
Research Brief | Updated September 30, 2026
Hiring by the Numbers: Why Hesitation Costs More Than the Hire
Most hiring decisions are framed as the risk of acting: the salary, the fee, the chance of a bad fit. The data points the other way. Vacancies compound, top candidates disappear in days, growth windows close, and the labor market of 2026 rewards the employers who move with discipline. This brief pulls together government data, benchmarking studies, and peer-reviewed research so you can see the math for yourself.
Five things the data says about hiring in 2026
Each section below stands on its own. Every figure is linked to its source, and the charts were built directly from the underlying data, including the Bureau of Labor Statistics series through August 2026.
01 | The Cost of Waiting
It Costs More Money to Hesitate on Hiring
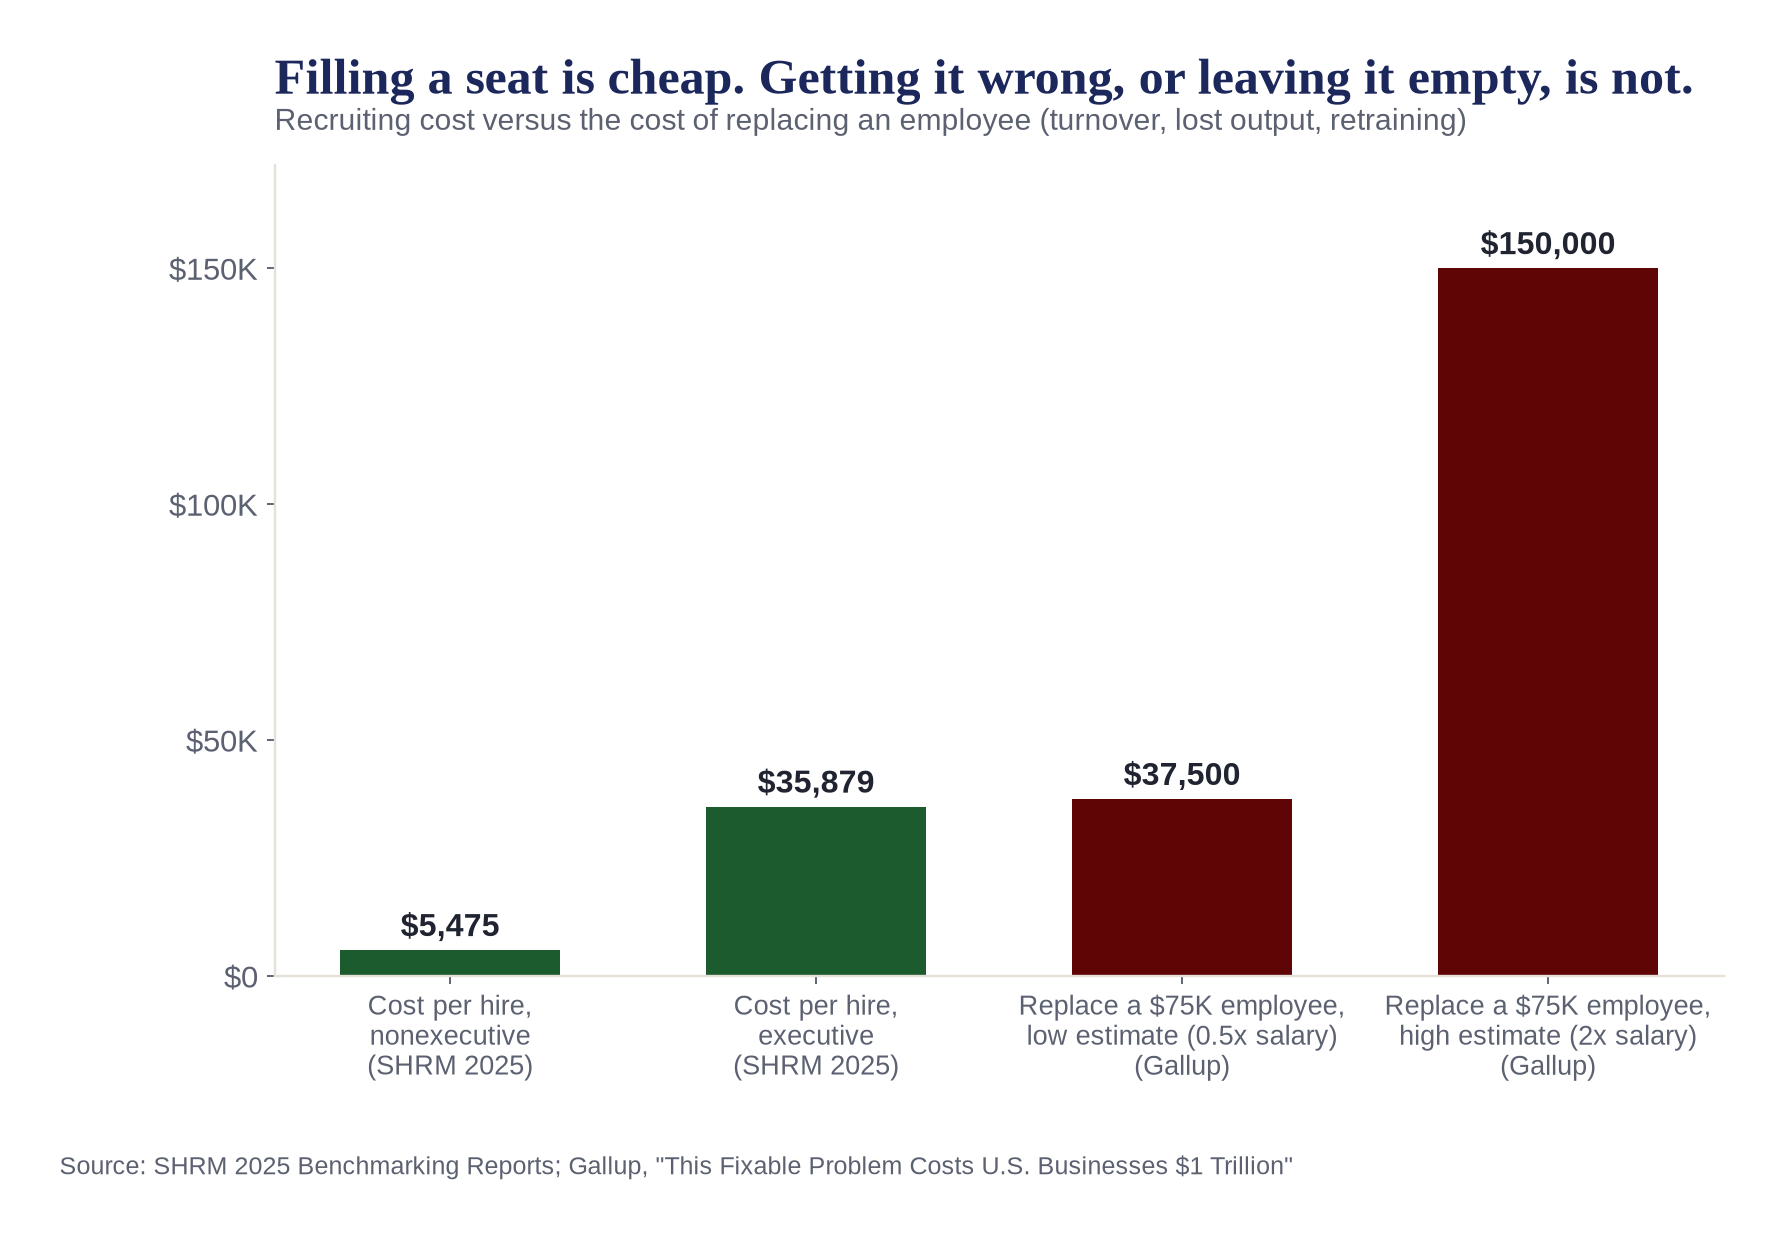
The visible cost of hiring is small and well documented. SHRM’s 2025 benchmarking puts the average cost per hire at $5,475 for nonexecutive roles and $35,879 for executives, nearly seven times more (SHRM). The invisible cost is what the empty seat and the eventual mis-hire do to the business.
Gallup estimates that replacing a single employee costs one-half to two times their annual salary once lost productivity, recruiting, and ramp-up are counted, and that voluntary turnover drains roughly $1 trillion a year from U.S. businesses (Gallup). For a $75,000 role, that is $37,500 to $150,000 per departure, against a $5,475 recruiting cost to fill it well the first time.
The speed gap is the hesitation tax
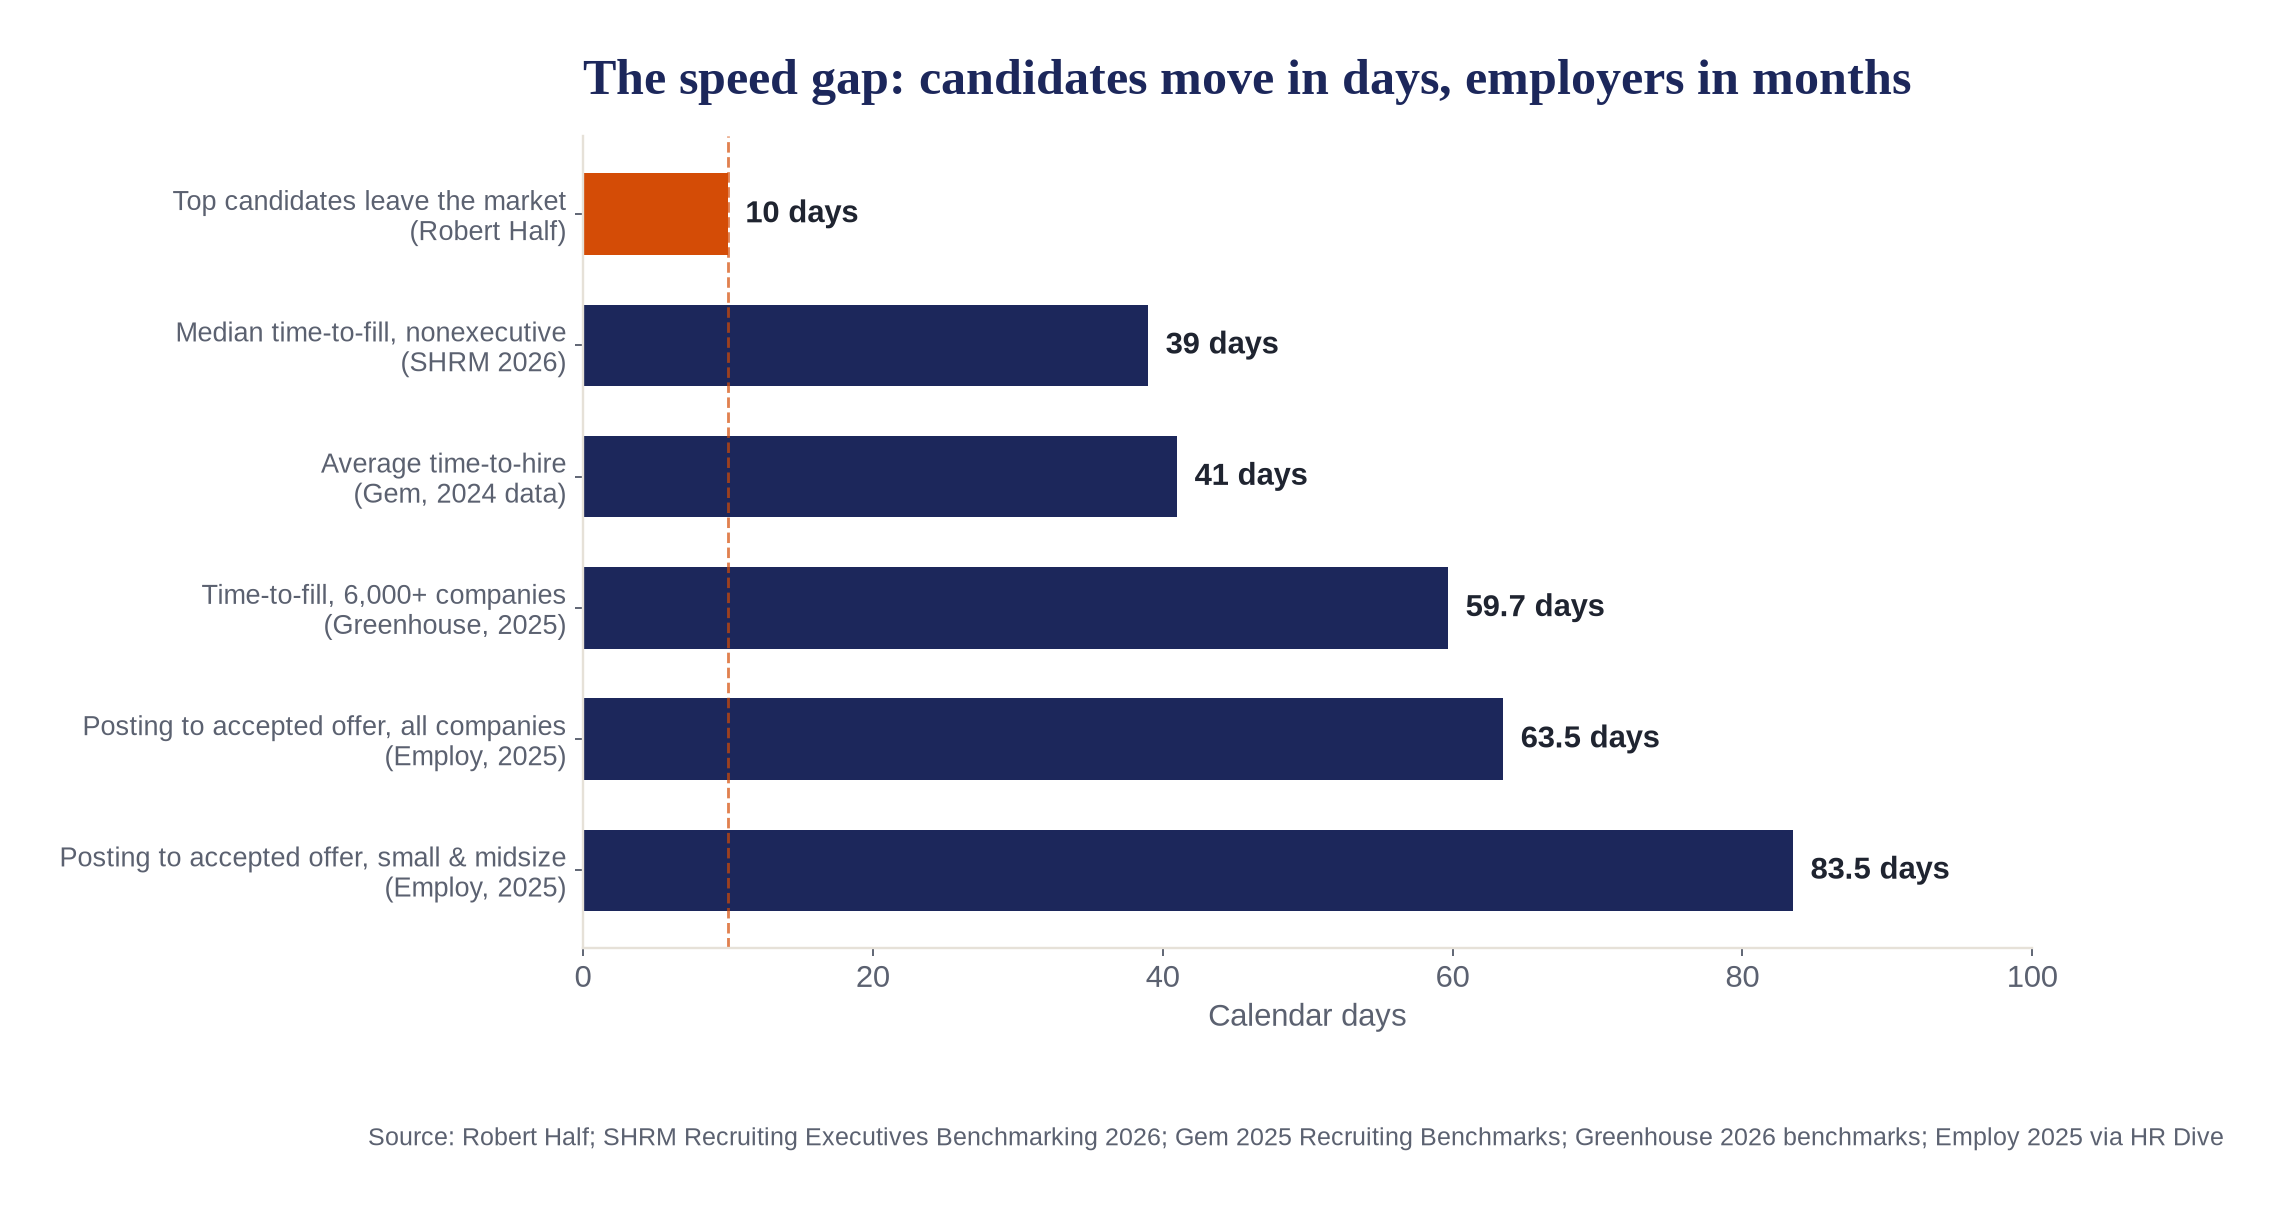
Robert Half’s research finds the best candidates are off the market within about 10 days (Robert Half via Hyring). Employers are nowhere close. SHRM’s 2026 benchmarking of 4,600+ organizations puts the median time-to-fill at 39 calendar days for nonexecutive roles (SHRM 2026), after hitting 44 days in 2025, the slowest since SHRM began tracking (Pin).
Gem’s analysis of 1.3 million hires shows average time-to-hire rose 24%, from 33 days in 2021 to 41 days in 2024, while interviews per hire jumped from 14 to 20 (Gem). Employ’s 2025 data puts posting-to-accepted-offer at 63.5 days overall and 83.5 days at small and midsize companies, versus 51.7 at enterprises (HR Dive). Greenhouse’s 6,000-company dataset shows time-to-fill up 37% from 2022 to 2025 (Greenhouse).
Slowness is not neutral. Tellent’s State of Hiring report finds hiring cycles longer than 40 days see a 12% increase in candidate drop-off (Tellent).
of small-business owners hiring report few or no qualified applicants; 33% have openings they cannot fill
02 | Growth Windows
Successful Companies Hit Acute Growth Periods Where Hiring Decides the Outcome
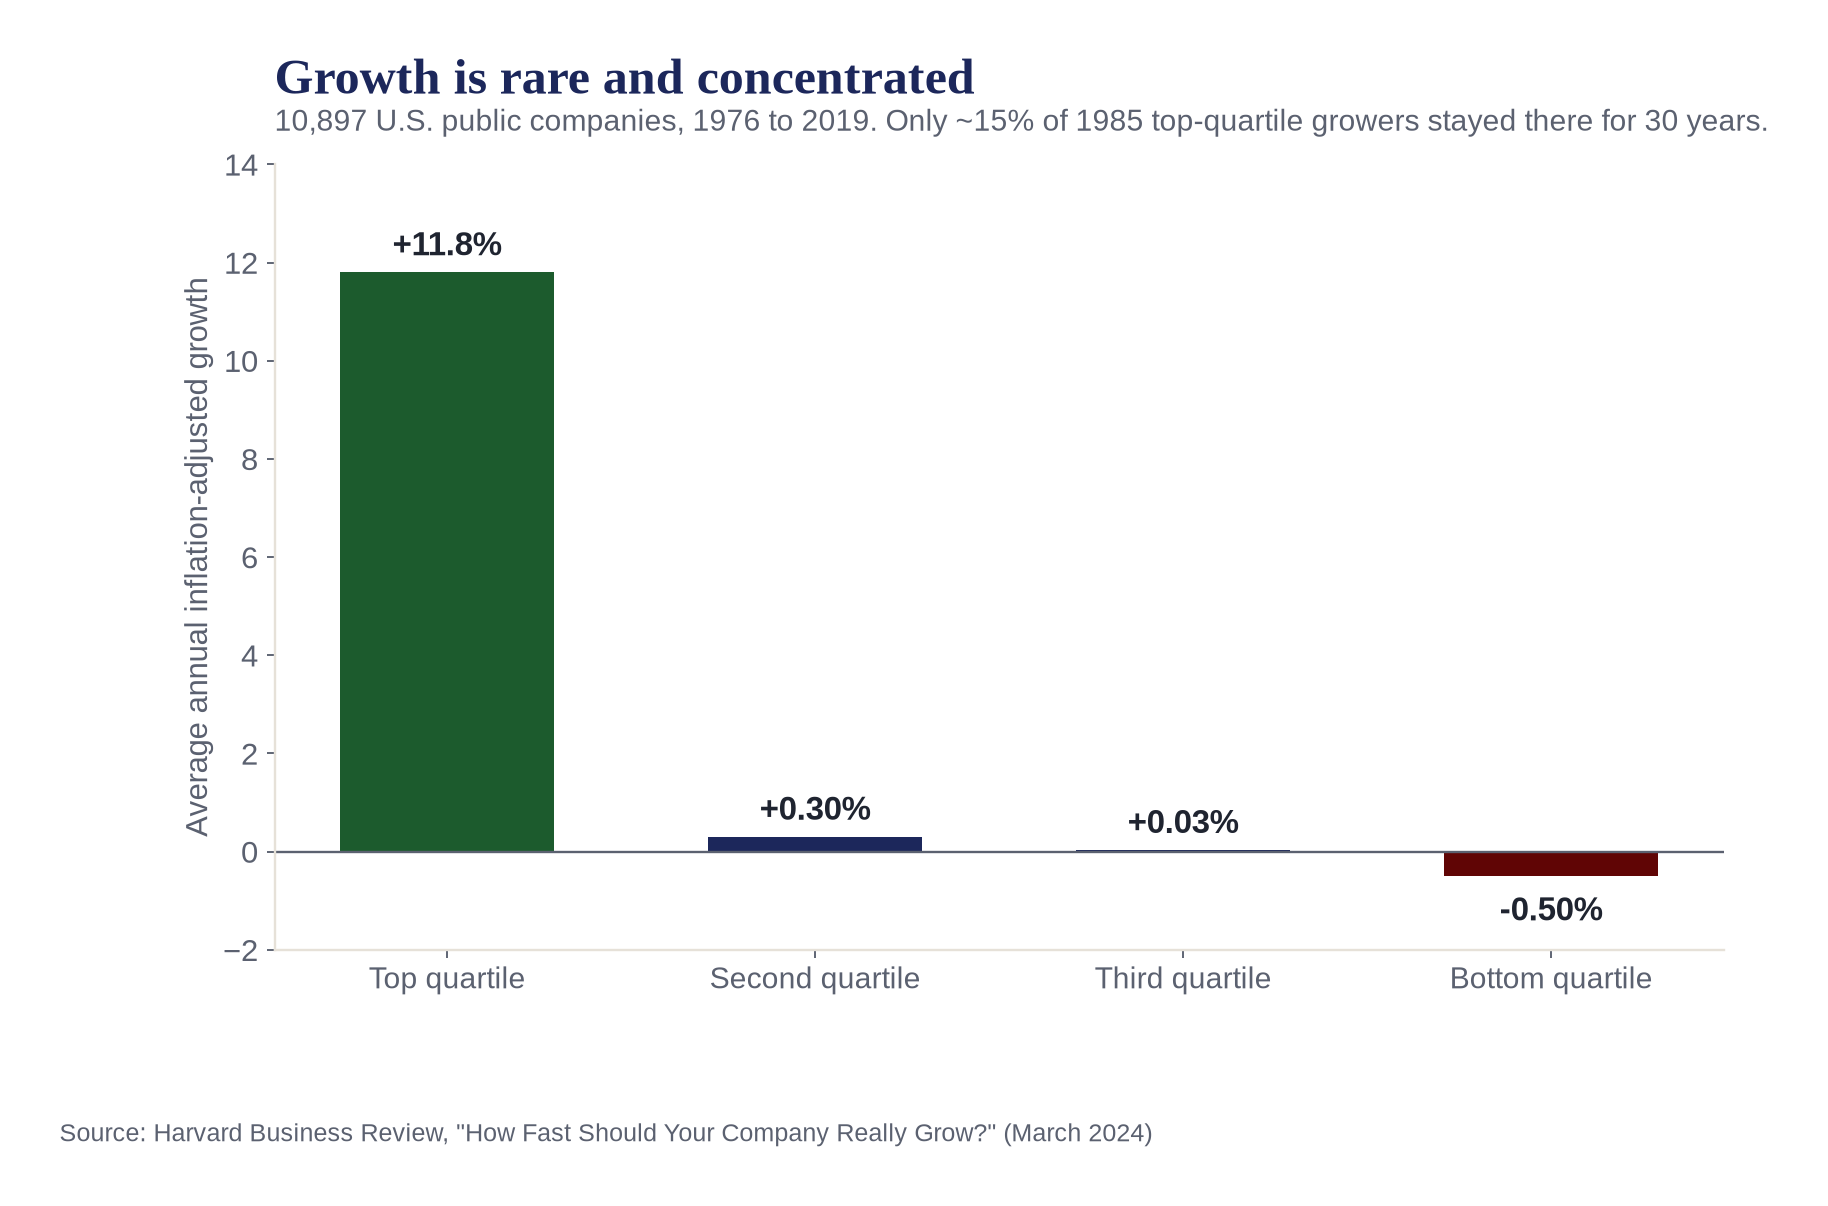
Sustained growth is far rarer than most leadership teams assume. A Harvard Business Review analysis of 10,897 U.S. public companies from 1976 to 2019 found the top quartile grew 11.8% a year after inflation while the second and third quartiles managed 0.3% and 0.03%, and the bottom quartile shrank. Only about 15% of 1985’s top-quartile growers held that position for 30 years (HBR). The authors’ diagnosis is that firms grow reactively: when demand booms they go on hiring binges without asking whether they can attract the human capital needed to deliver, or what happens if demand slows.
Premature scaling is a hiring problem
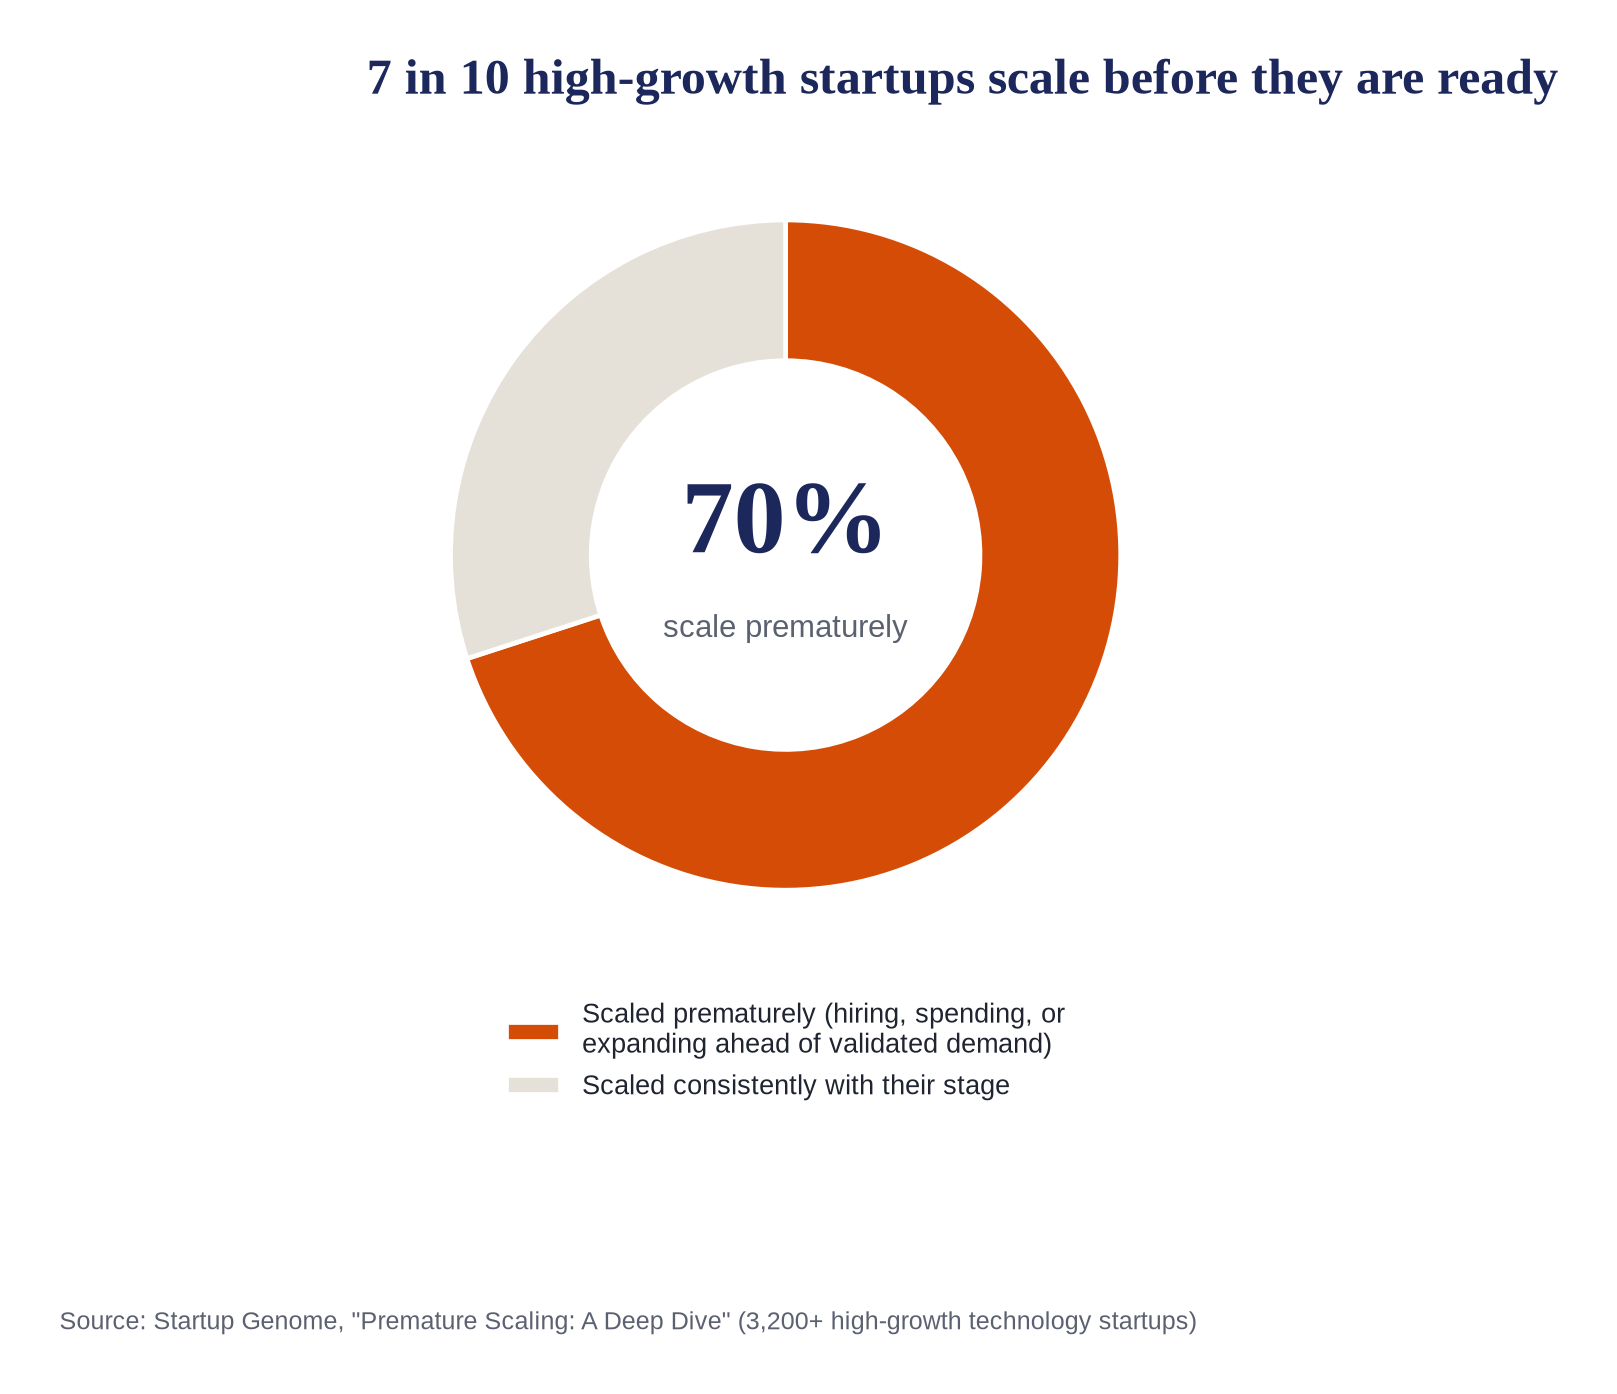
Startup Genome’s study of 3,200+ high-growth technology startups identified premature scaling as the primary cause of failure: 70% of startups scaled prematurely, 93% of those never exceeded $100,000 in monthly revenue, and startups that scaled properly grew about 20 times faster (Startup Genome).
The mechanism was people. Prematurely scaling startups had teams three times larger than consistent startups at the same stage, hired specialists before they were critical, hired managers instead of doers, and stacked management layers early. Companies that scaled well took 76% longer to reach the same headcount, and grew faster for it. The lesson is not to hire less. It is that every hire in a growth window is a strategic decision, not a headcount fill.
Mistakes compound at scale
Harvard Business School’s Rock Center guidance for founders describes three consequences of hypergrowth: the cost of mistakes increases exponentially, culture dilutes, and staff burn out. A decision that cost $10,000 early can cost millions during rapid scaling, and culture, they note, must be embedded in recruiting and onboarding because it cannot be outsourced (HBS Startup Guide).
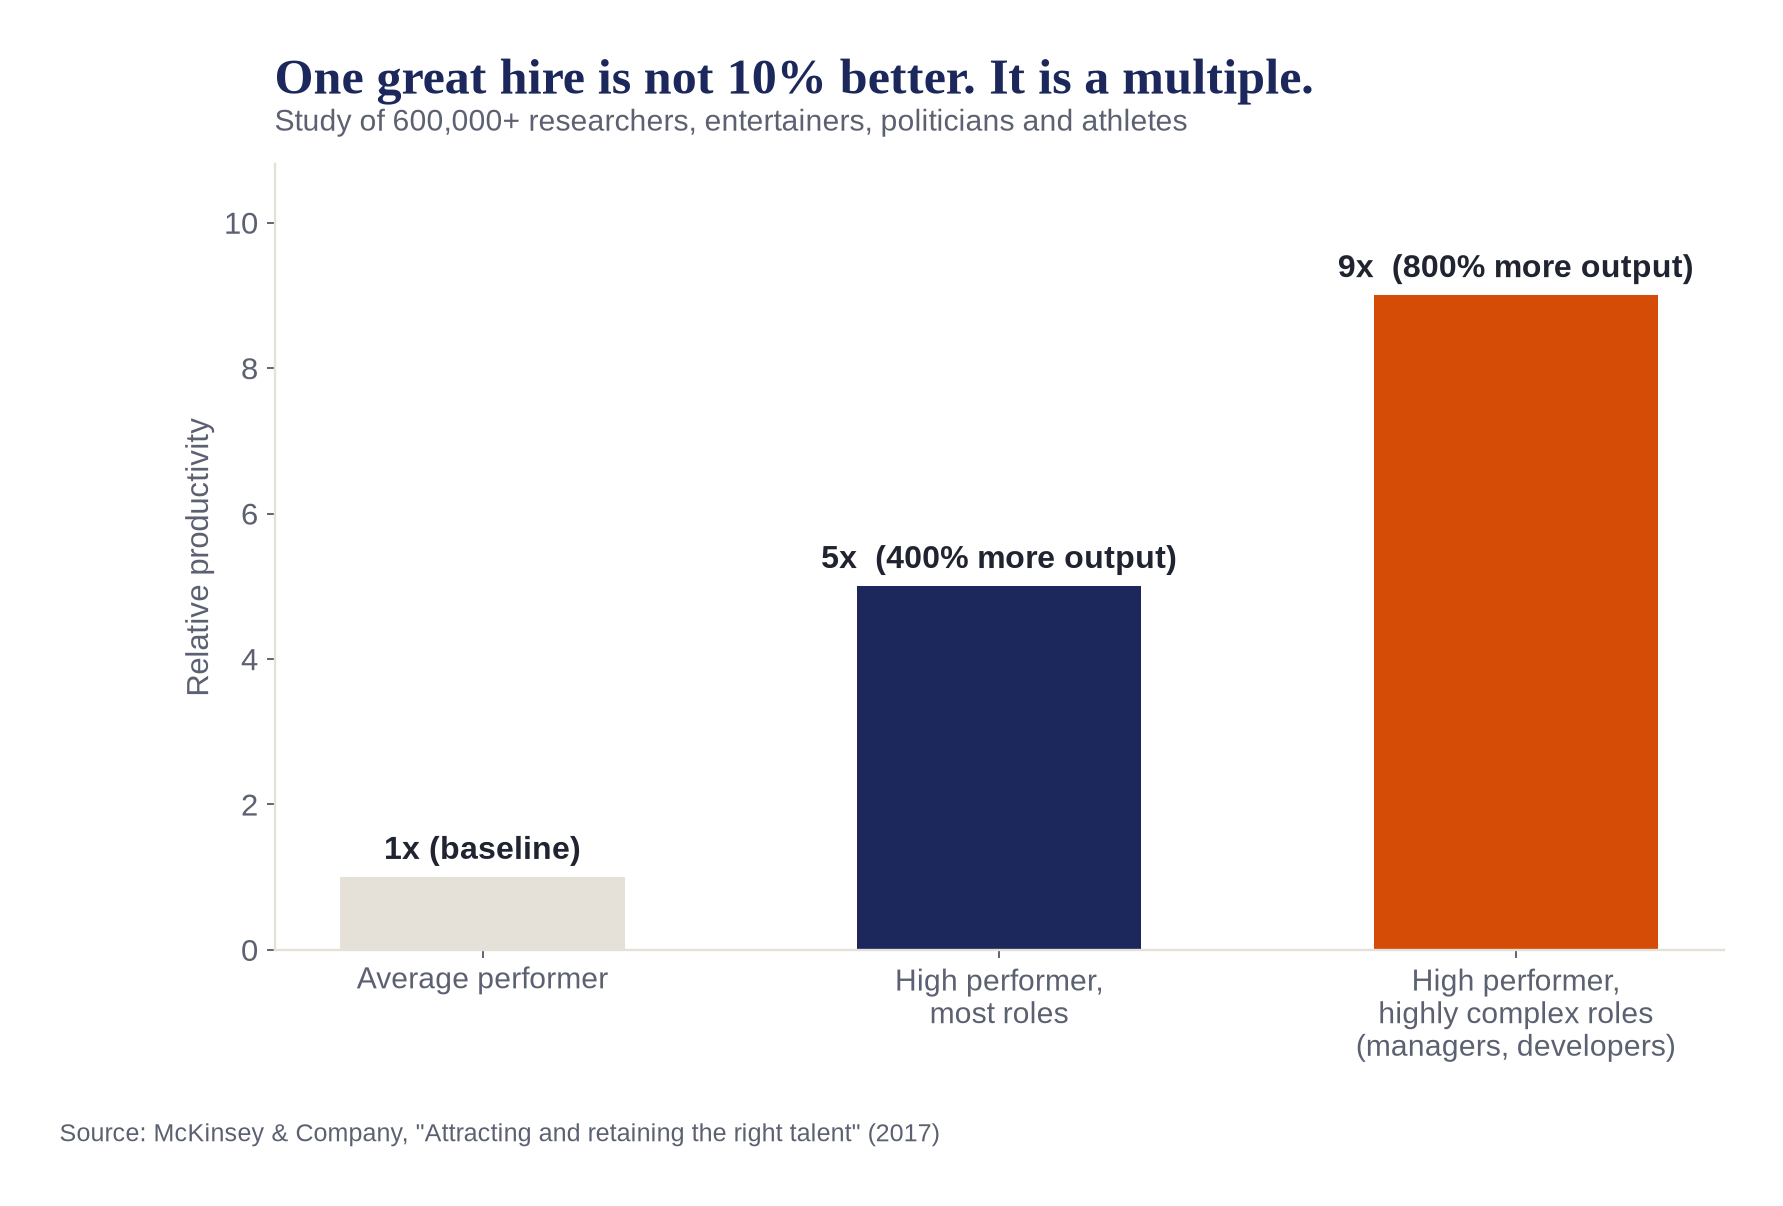
McKinsey quantifies why the right people matter so much in those windows. In a study of more than 600,000 researchers, entertainers, politicians, and athletes, high performers were 400% more productive than average, and 800% more productive in highly complex roles such as managers and software developers. Replacing just 20% of average talent with great talent on a three-year initiative shrinks it to under two years, or under one year in complex work (McKinsey). A competitor with 20% more great talent can start one or two years later and still beat you to market.
03 | The Workload Nobody Budgets For
Finding a Job, and Filling One, Is a Full-Time Job
Both sides of the hiring table are doing a second job on top of their first one. The volume has roughly doubled since 2022 while the people available to handle it have shrunk.
For the job seeker
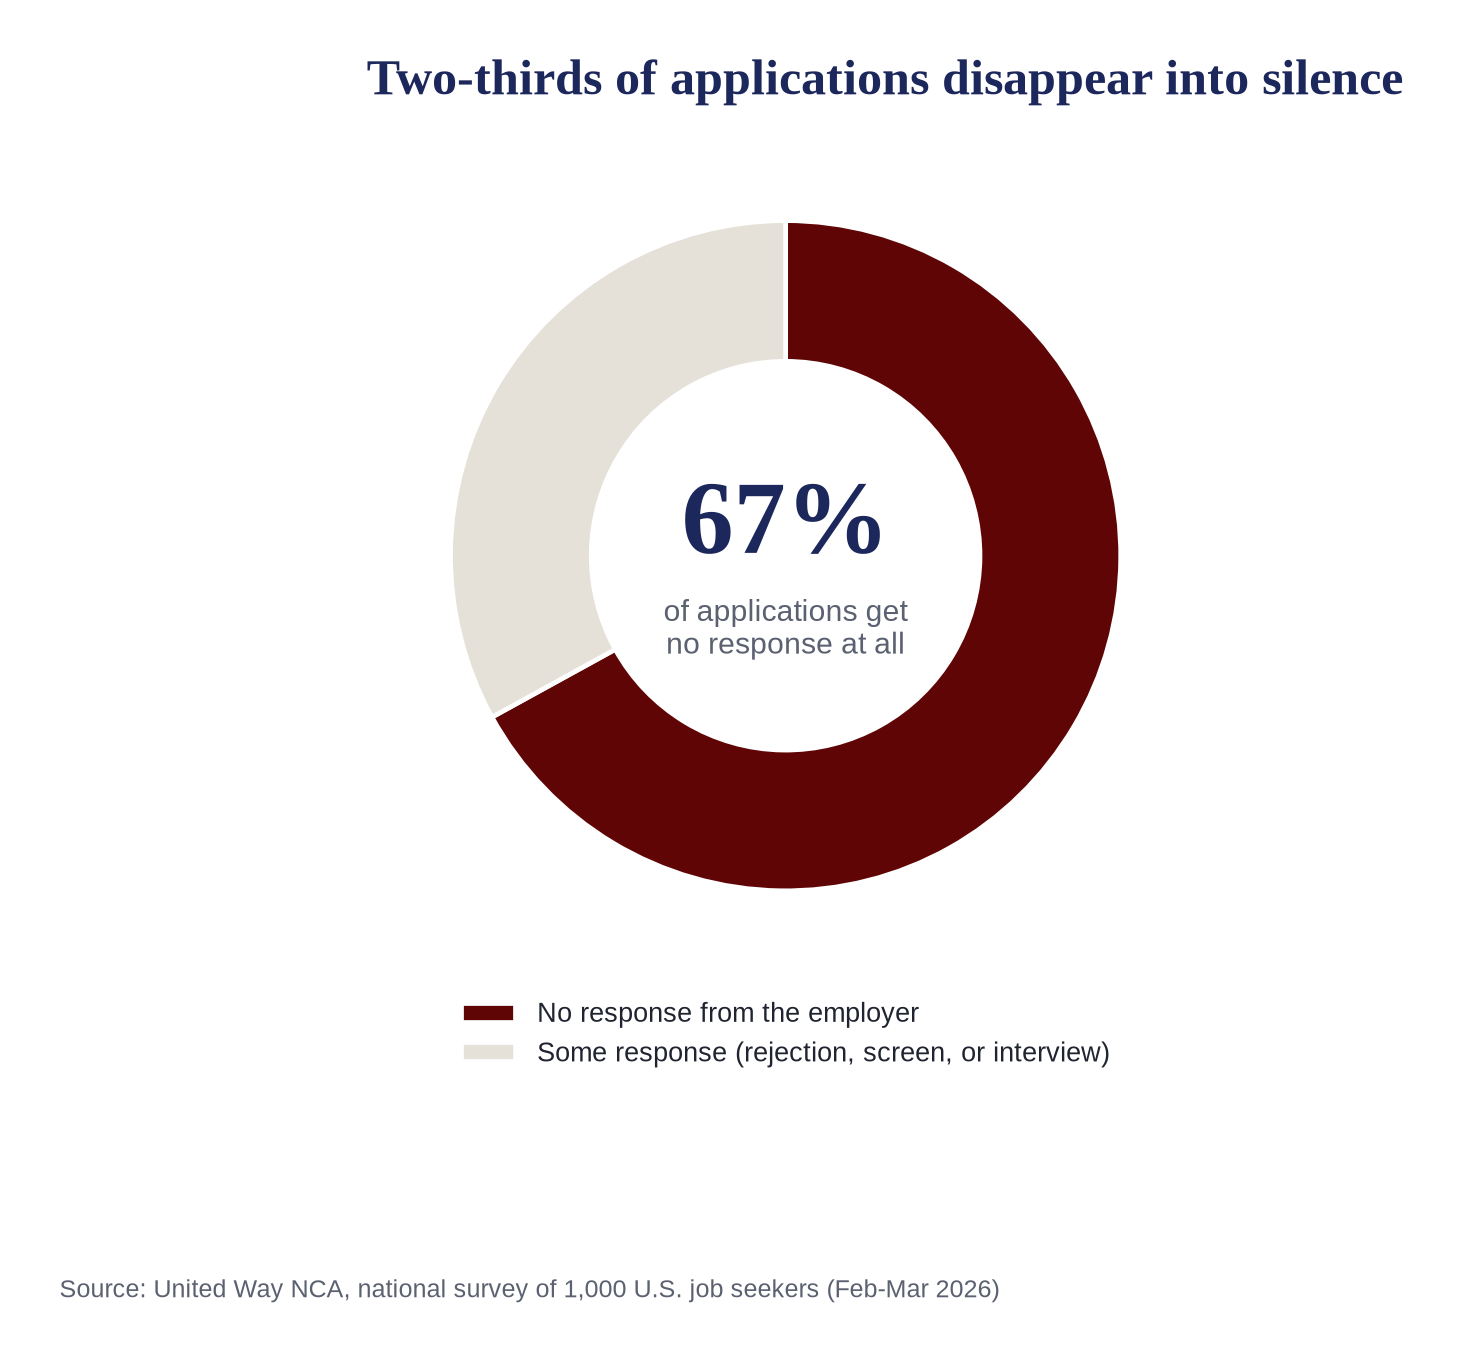
United Way NCA’s national survey of 1,000 U.S. job seekers (February to March 2026) found the average search lasts 6.6 months, requires 62.6 applications at about 44 minutes each, or 46.2 hours of pure application work, and yields fewer than five interviews. 67% said searching felt like a full-time job and nearly 80% reported burnout. 94.3% had applied and never heard back at least once, and 43.6% were rejected after reaching final rounds (United Way NCA).
The macro data agrees. In August 2026, 1.9 million Americans had been unemployed 27 weeks or longer, 27% of all unemployed (BLS).
For the employer
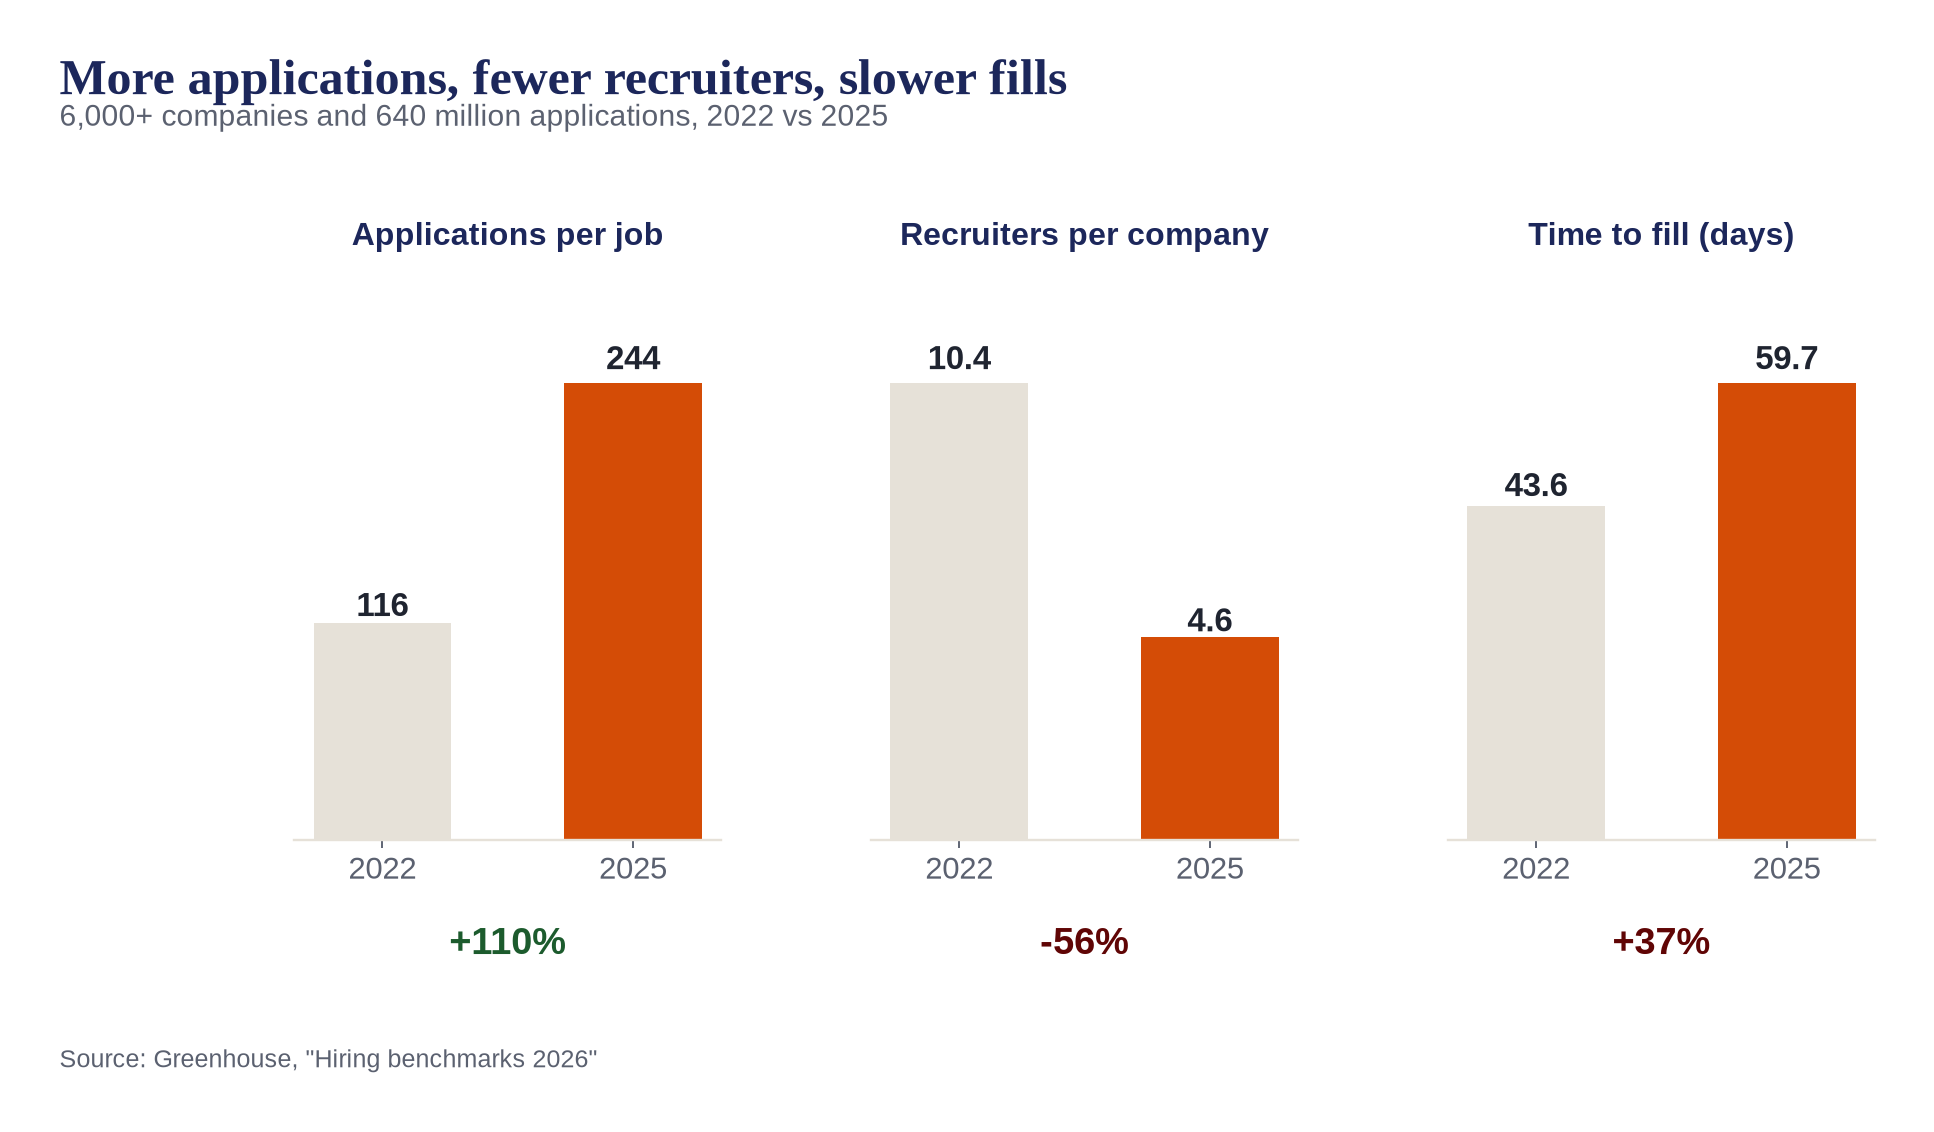
Greenhouse’s benchmark of 6,000+ companies and 640 million applications shows applications per job rose from 116 in 2022 to 244 in 2025 while recruiters per company fell 56%, from 10.4 to 4.6. Applications per recruiter tripled to 4,890 a year (Greenhouse).
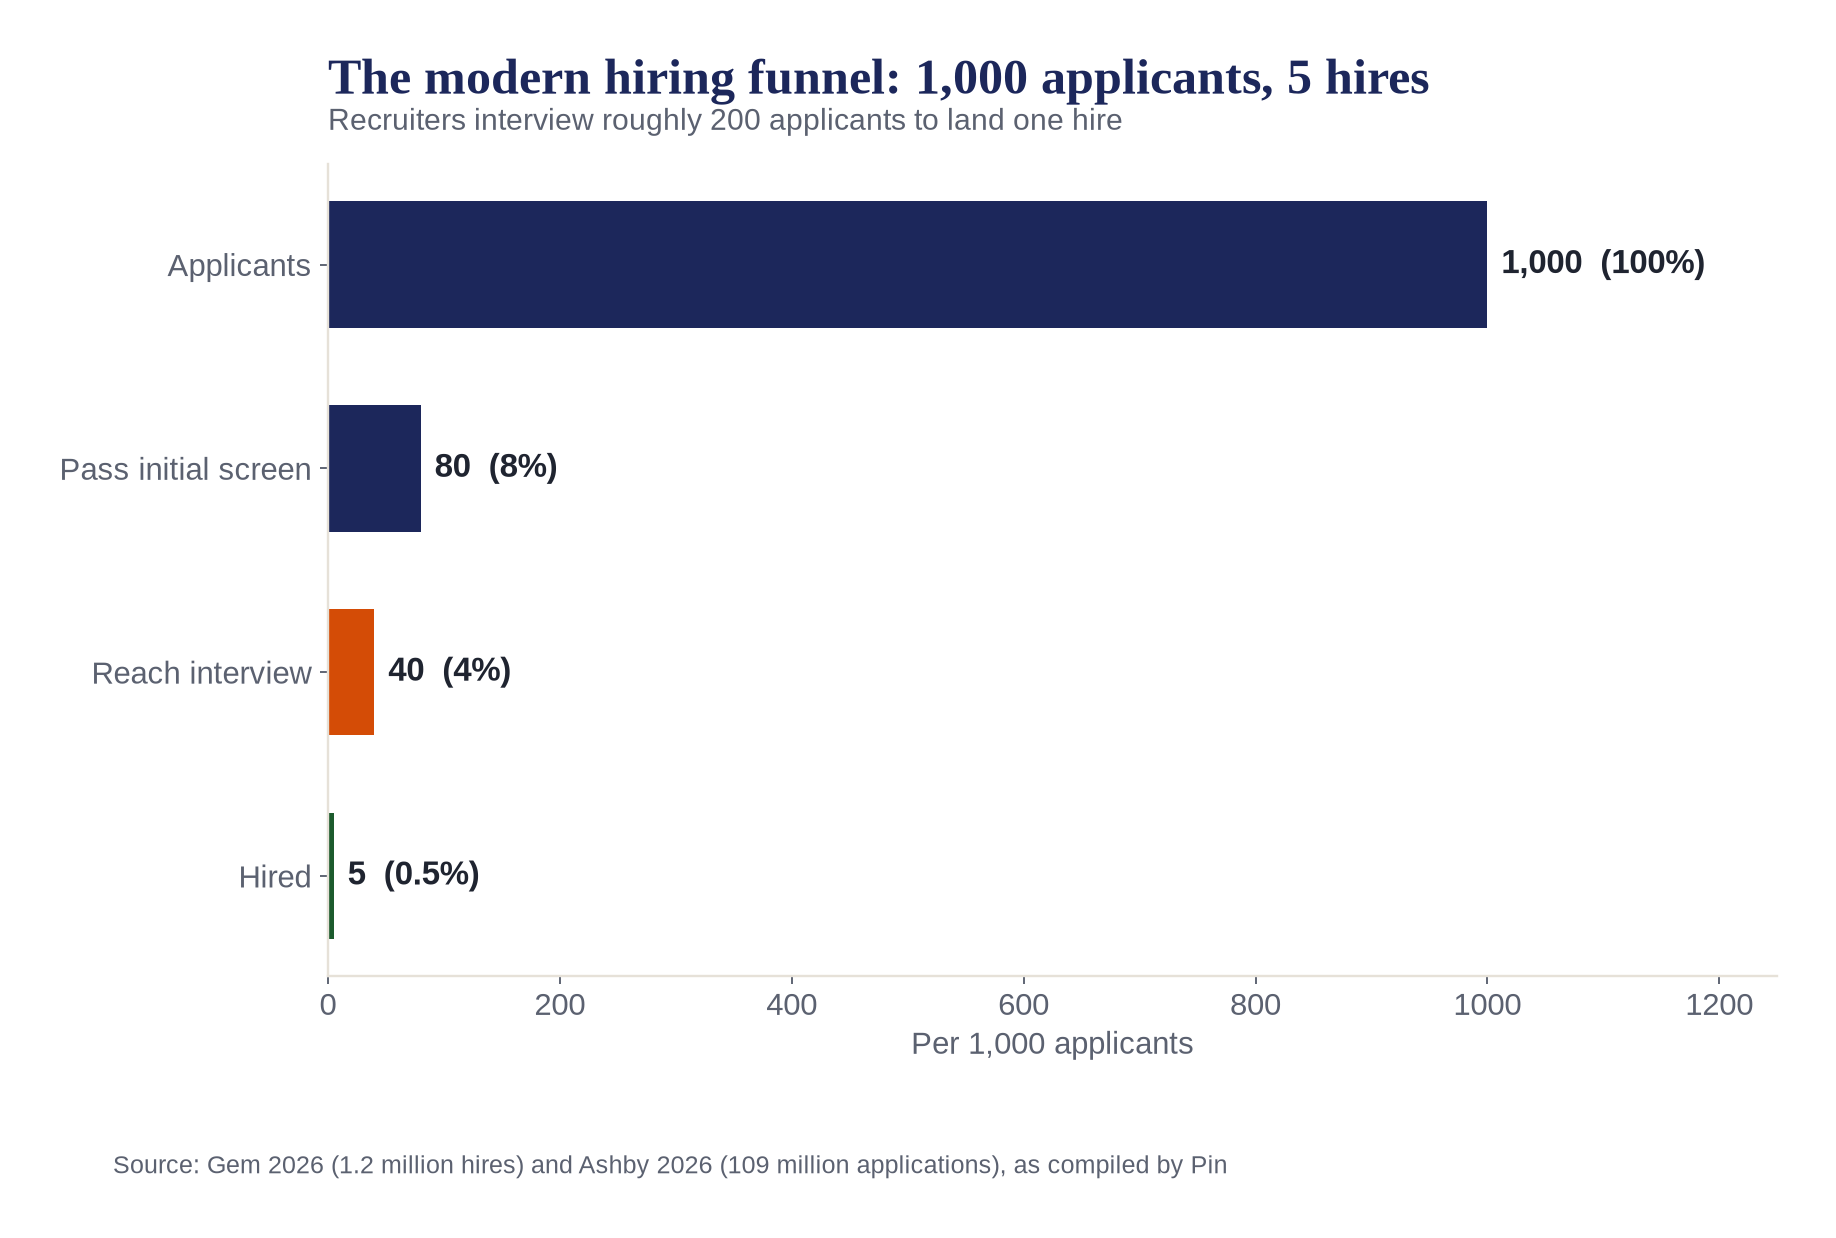
Gem’s data shows hiring teams now run 20 interviews per hire, up from 14 in 2021, and 33 interviews per hire for sourced (outbound) candidates (Gem). Only 0.5% of applicants receive an offer (Gem and Ashby via Pin). Recruiters spend about 38% of their week on scheduling alone (GoodTime via interviewstream), and a careful end-to-end hire consumes roughly 100 person-hours in a best case (Kaplan-Moss).
04 | The Market Has Moved
The Employment Market Is Not What It Was in 2020, and Hardly What It Was in 2025
Three different labor markets have come and gone in six years. In April 2020 there were five unemployed workers for every opening. By March 2022 there were two openings for every unemployed worker and 12.3 million jobs were open. In August 2026 the ratio sits at one-to-one with 7.1 million openings, 5.2 million hires, 3.1 million quits and 1.6 million layoffs (BLS JOLTS, Sept. 29, 2026). Payrolls grew 162,000 in August and unemployment held at 4.1% (BLS Employment Situation).
| Measure (seasonally adjusted) | Feb 2020 Pre-pandemic | Apr 2020 Shutdown | Mar 2022 Great Resignation peak | Aug 2025 | Aug 2026 |
|---|---|---|---|---|---|
| Job openings | 7.0M | 4.6M | 12.3M | 6.9M | 7.1M |
| Hires rate | 3.9% | 3.1% | 4.4% | 3.2% | 3.3% |
| Quits rate | 2.3% | 1.5% | 2.9% | 2.0% | 1.9% |
| Layoffs & discharges rate | 1.3% | 7.0% | 0.9% | 1.2% | 1.0% |
| Unemployed per job opening | 0.8 | 5.0 | 0.5 | 1.1 | 1.0 |
| Unemployment rate | 3.5% | 14.8% | 3.7% | 4.3% | 4.1% |
Source: U.S. Bureau of Labor Statistics, JOLTS and Current Population Survey series retrieved via the BLS public data API on September 30, 2026.
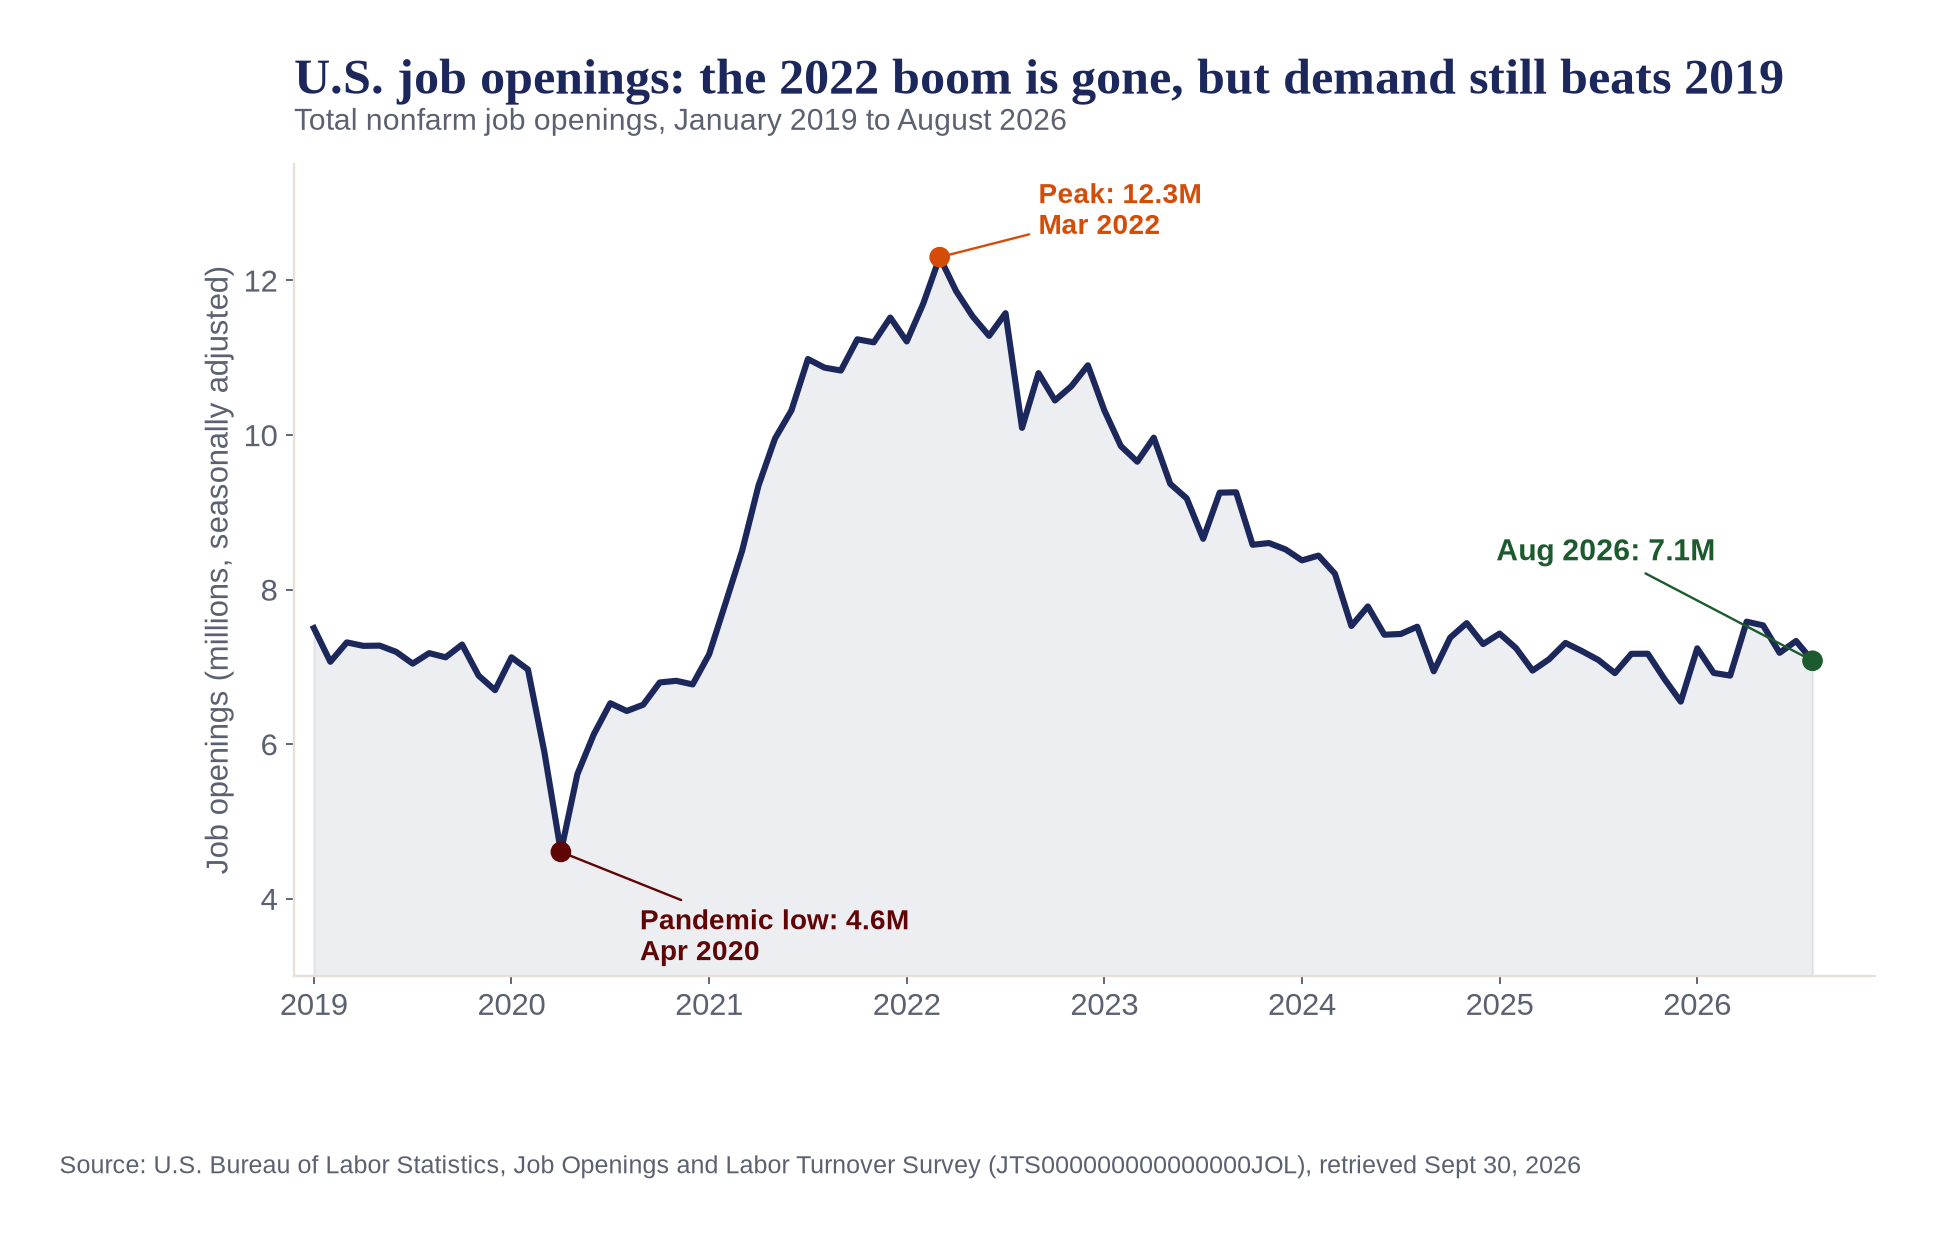
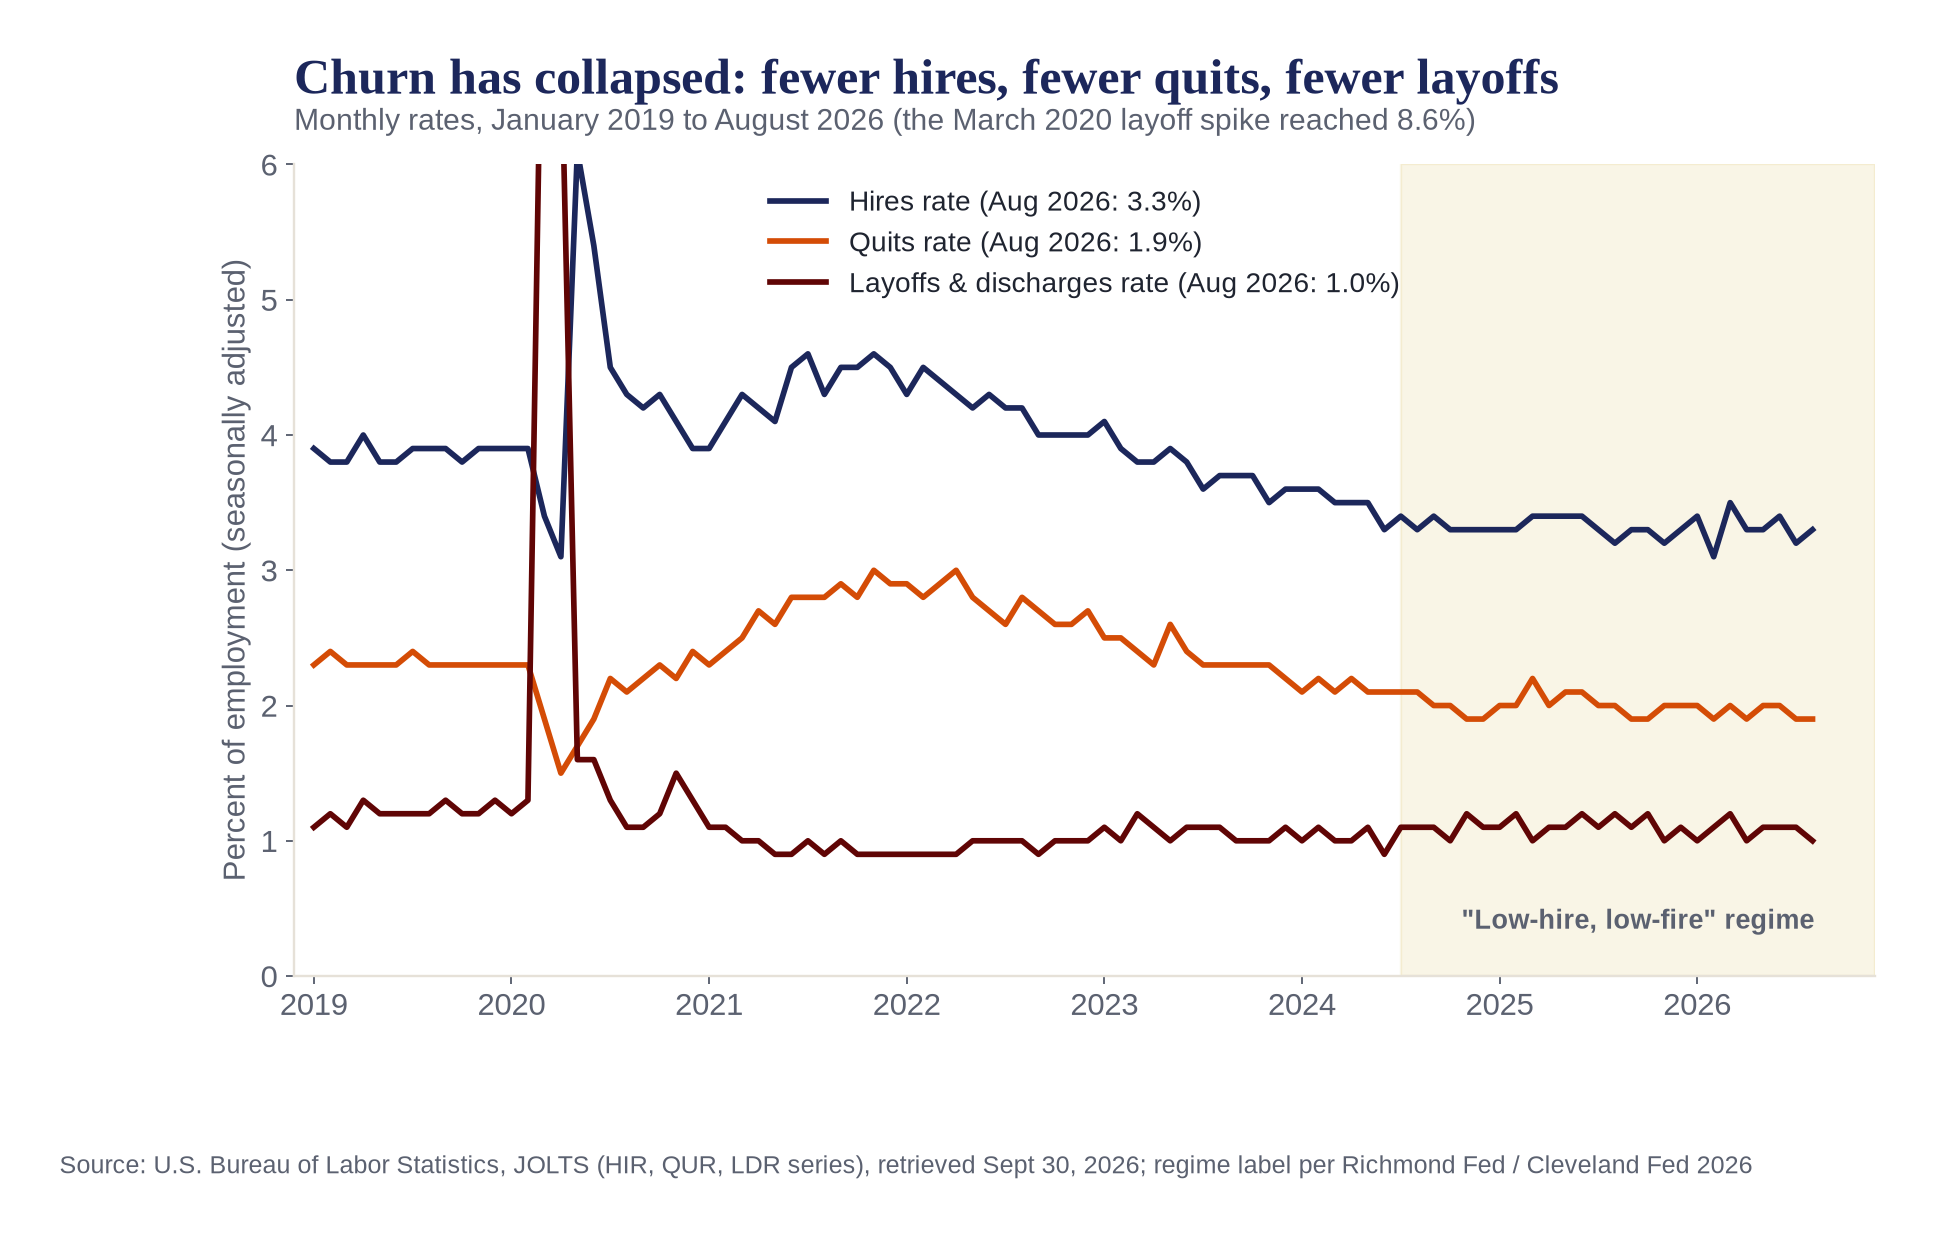
2025 to 2026: from frozen to cautiously thawing
Indeed’s Hiring Lab described 2025 as a labor market in pause: postings began the year more than 10% above pre-pandemic norms and were barely above them by late October, wage growth slowed to about 2.5%, and healthcare, at 11% of employment, produced almost three-quarters of all net job growth (Indeed Hiring Lab). By late September 2026, Indeed reported annual growth in job postings had turned positive for the first time since 2022, led by software development and data roles (Yahoo Finance).
The Richmond Fed notes the July 2026 hiring rate of 3.2% has been lower in only 7% of months since December 2000, while the 1.0% layoff rate has been lower in only 4% of months. Its hiring-conditions index has sat below the 50th percentile for more than two years (Richmond Fed). The Cleveland Fed calls low hires, low quits and low layoffs together historically unusual for a healthy labor market (Cleveland Fed). In plain terms: employees are staying put, employers are not backfilling, and every open requisition matters more.
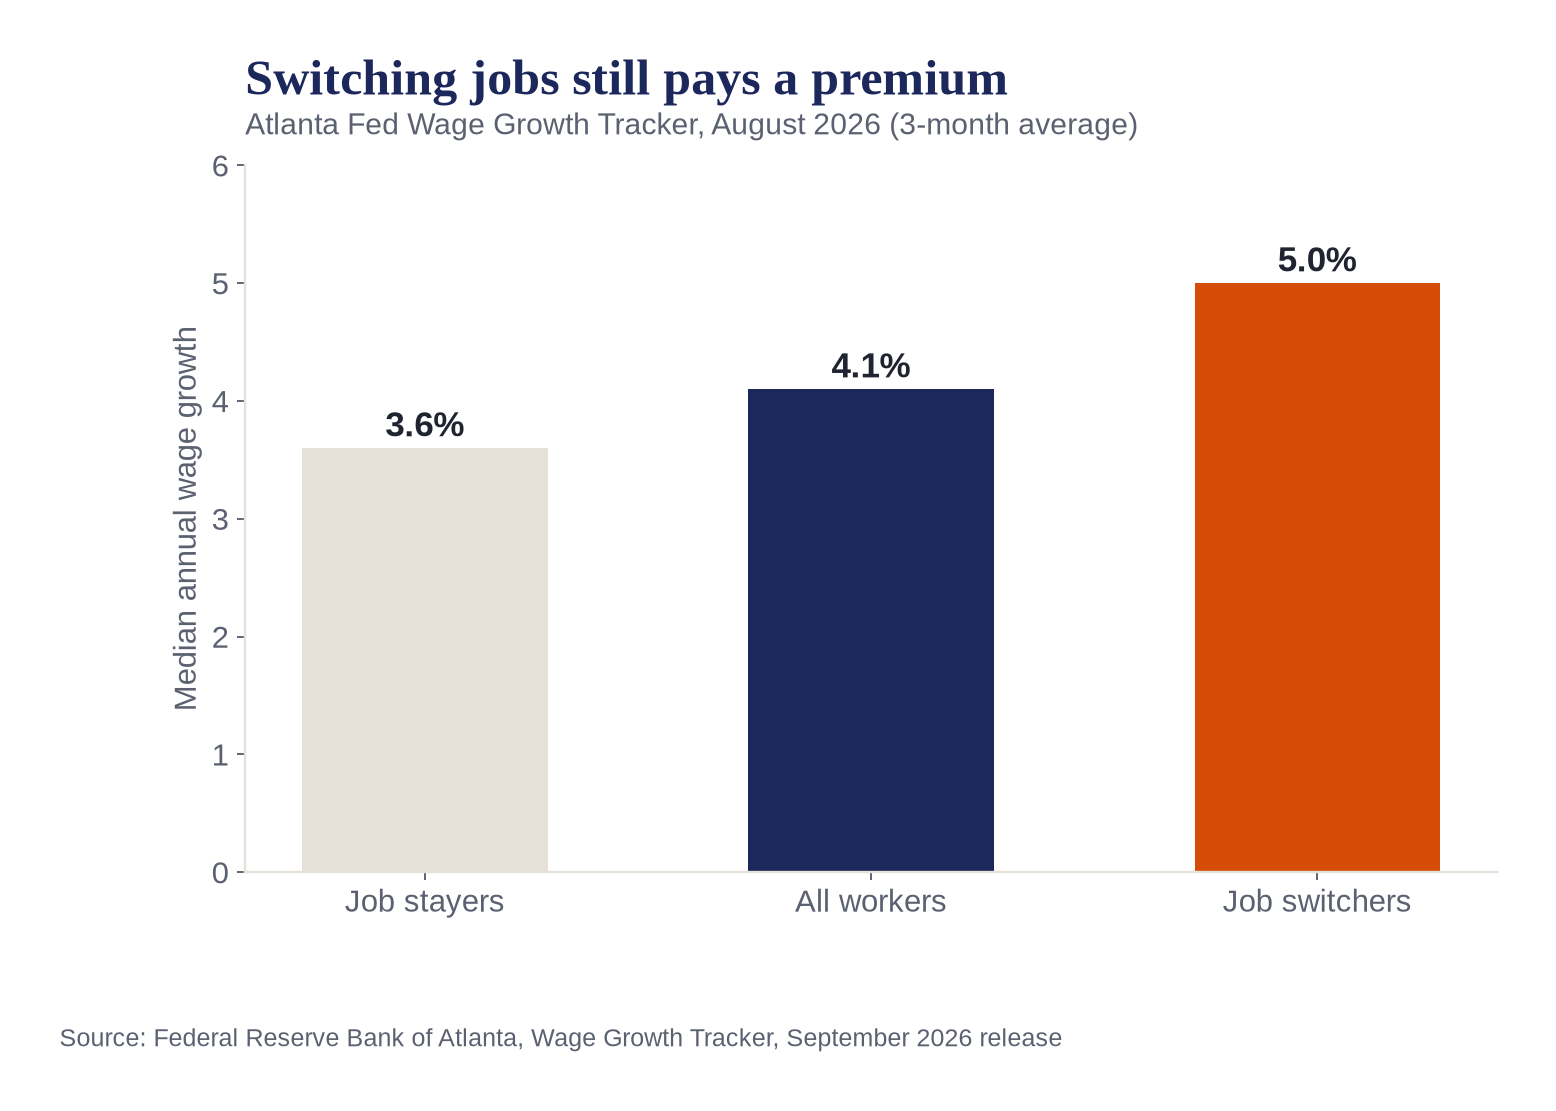
Remote is no longer the default lever
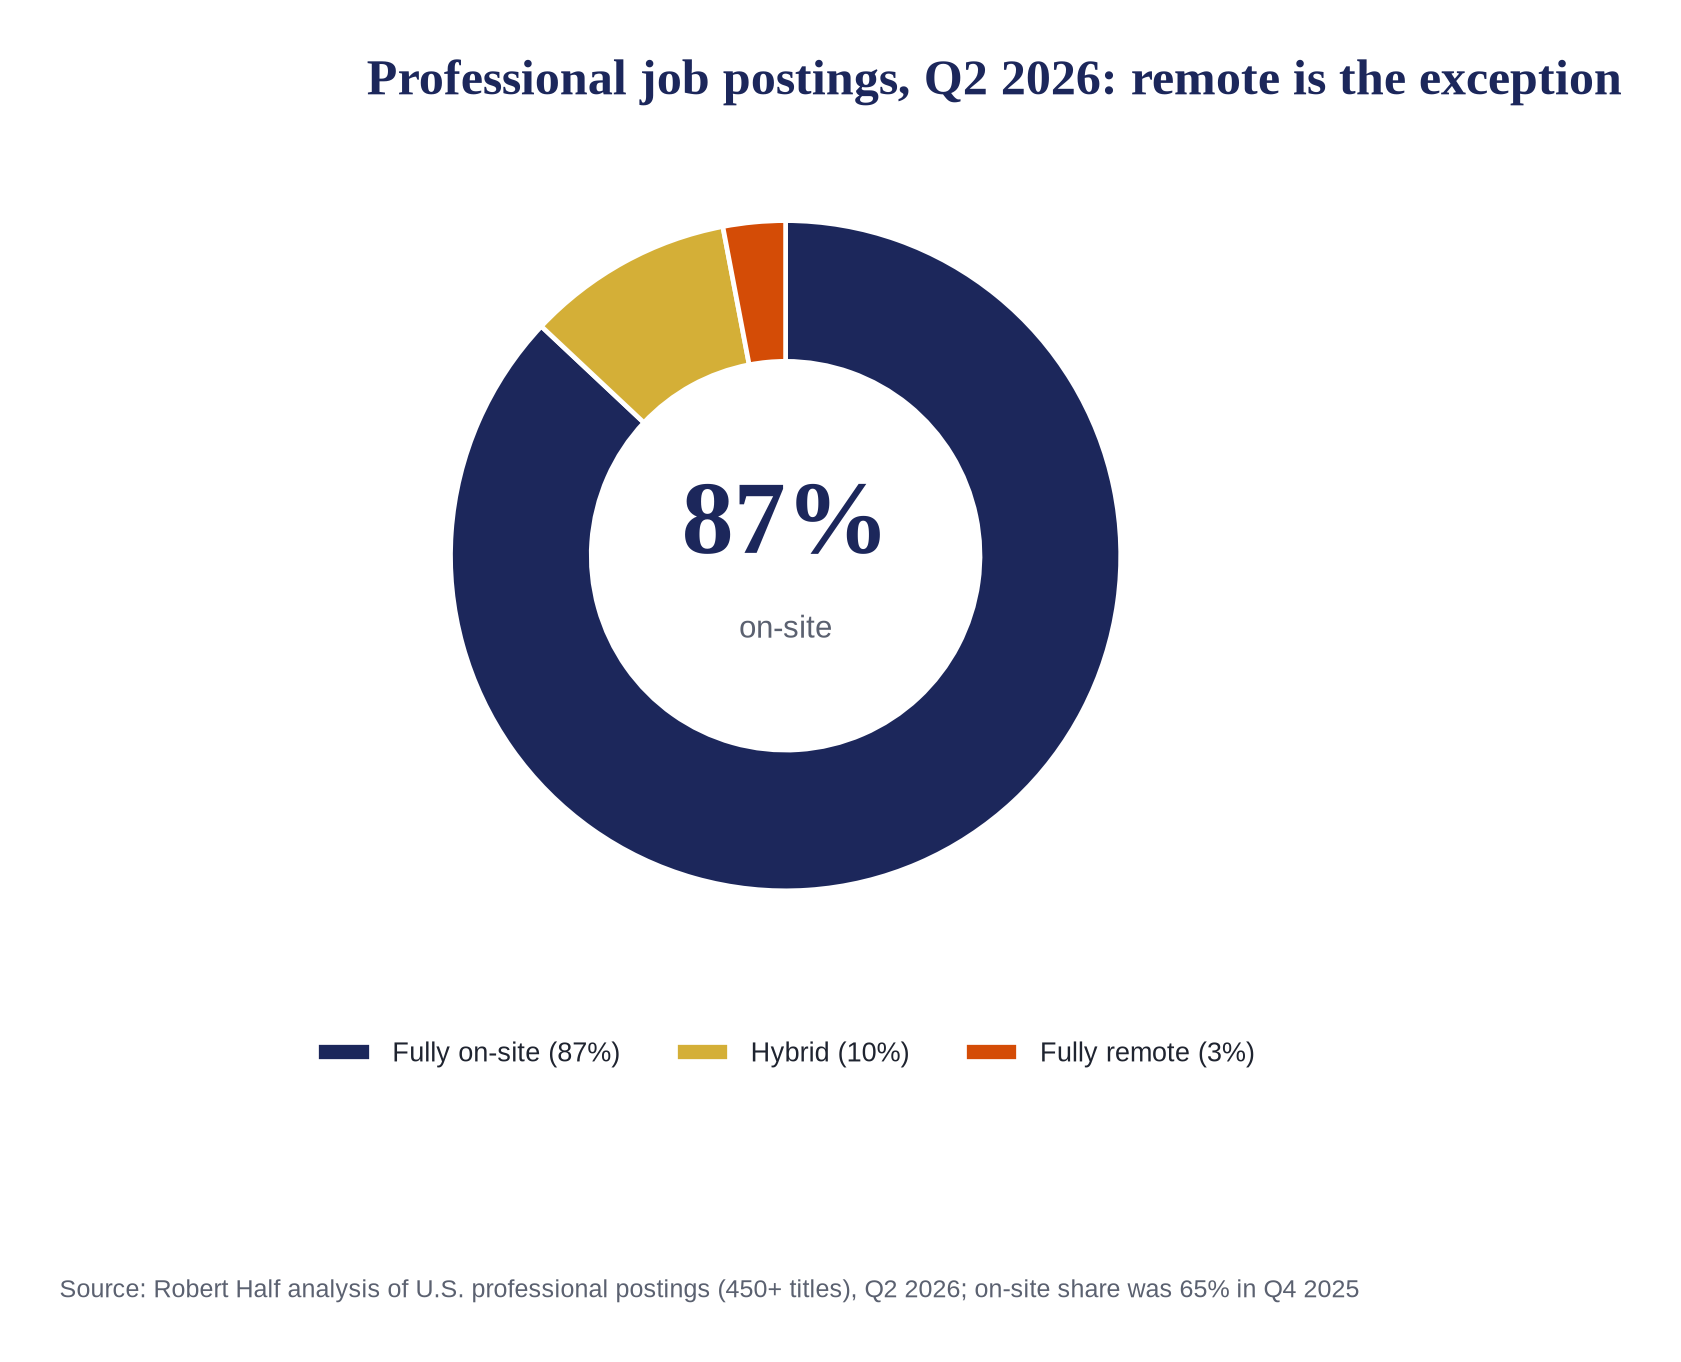
Indeed’s tracker shows 8.4% of U.S. postings mentioned remote or hybrid work at the end of August 2026, down from a 10.5% peak in February 2022 (Indeed data via Second Talent; Indeed Job Postings Index). Robert Half found 87% of professional postings fully on-site in Q2 2026, up from 65% two quarters earlier. Yet on LinkedIn, fully remote roles were about 8% of postings and drew 35% of applications, so the few remote roles are flooded while on-site roles compete for a shrinking pool of movers.
Meanwhile 18% to 27% of online listings are estimated to be ghost jobs with no active intent to fill (Jobgether), which erodes candidate trust in the postings that are real.
What employers are saying in 2026
of HR professionals had difficulty recruiting full-time employees; 53% of them say it is harder than a year ago
SHRM 2026 Talent Trends (2,094 HR professionals, Feb. 2026)
of employers report some level of AI adoption; 74% say AI skills are an advantage or requirement for at least some roles
of HR professionals say the hardest skills to find are judgment, decision-making, and complex problem solving
Two more shifts define 2026. ZipRecruiter finds 64% of employers say AI is changing the skills they seek and 57% have raised baseline productivity expectations (ZipRecruiter). And LinkedIn reports 37% of talent teams are experimenting with or integrating generative AI, up ten points in a year (LinkedIn Future of Recruiting). The bar for every hire is higher, the tools are changing, and the candidates you want are employed, well paid to stay, and rarely applying to postings.
05 | What Actually Works
Little-Known but Well-Documented Truths About Hiring
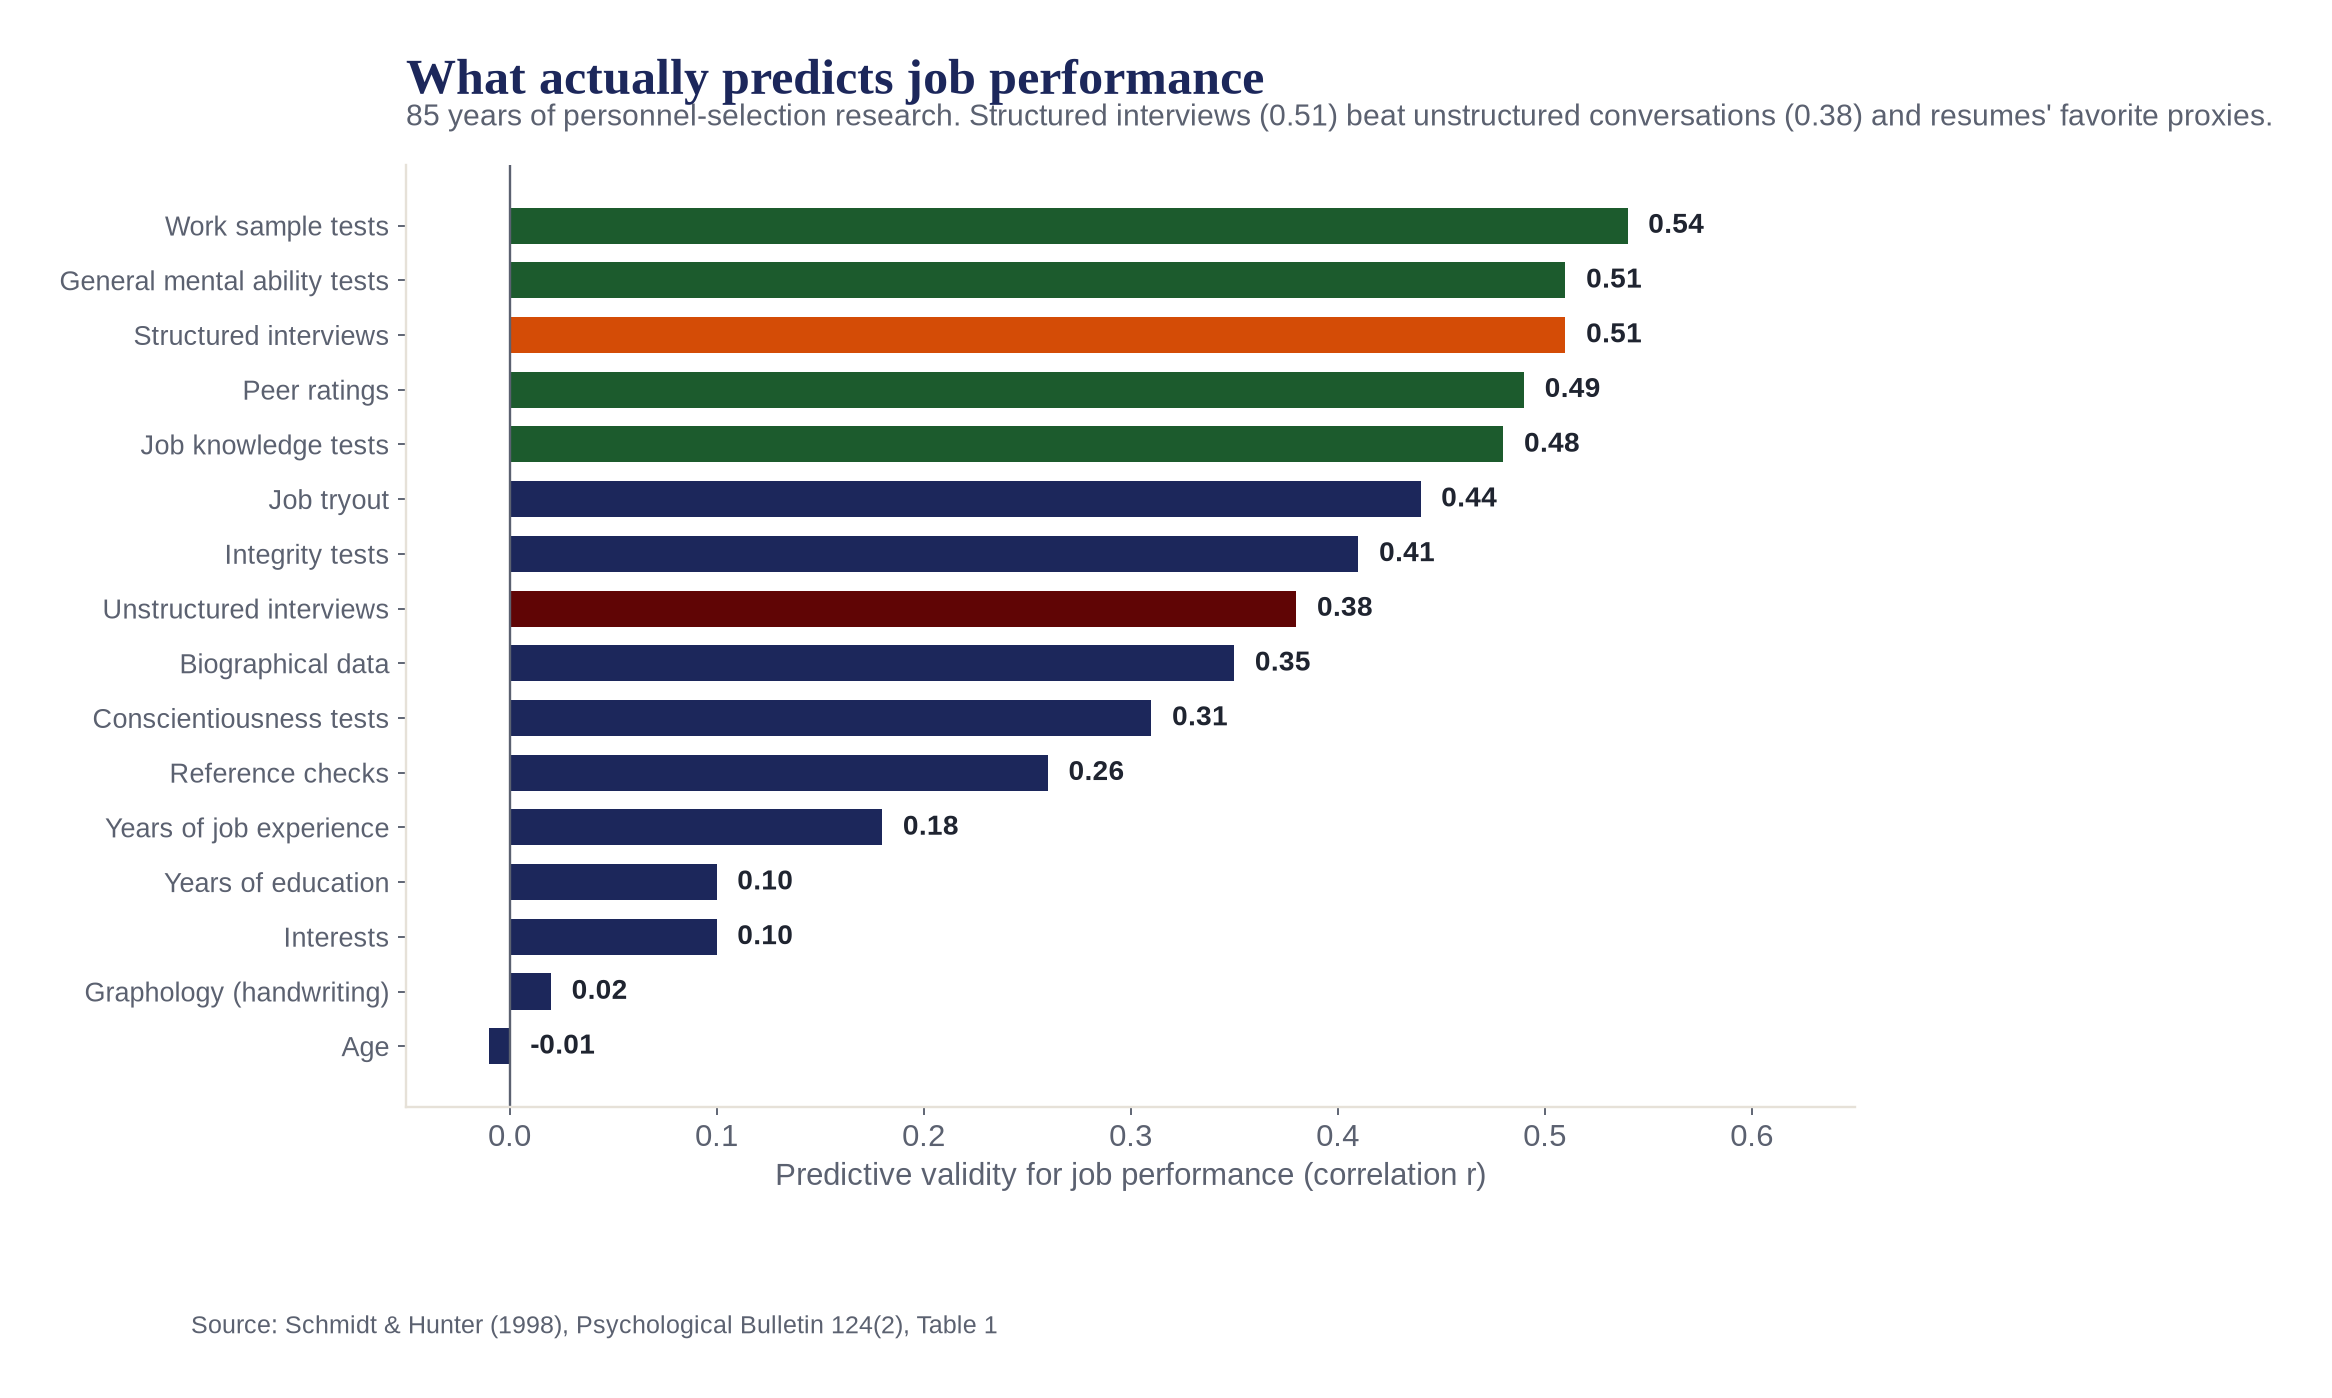
The resume is the weakest evidence you will collect
Schmidt and Hunter’s meta-analysis of 85 years of selection research, still the most-cited validity table in industrial psychology, found years of education predict performance at r = .10 and years of experience at .18. Reference checks score .26. An unstructured interview, the friendly chat most managers rely on, reaches .38. A structured interview scores .51, a work sample test .54 (Schmidt & Hunter, 1998).
In practical terms, the two things most hiring processes lean on hardest, credentials and gut-feel conversations, are among the least predictive tools available. Calibrated scorecards and consistent structured interviews are not bureaucracy; they are the difference between a coin flip and a forecast.
Quality of hire is the metric everyone wants and few track
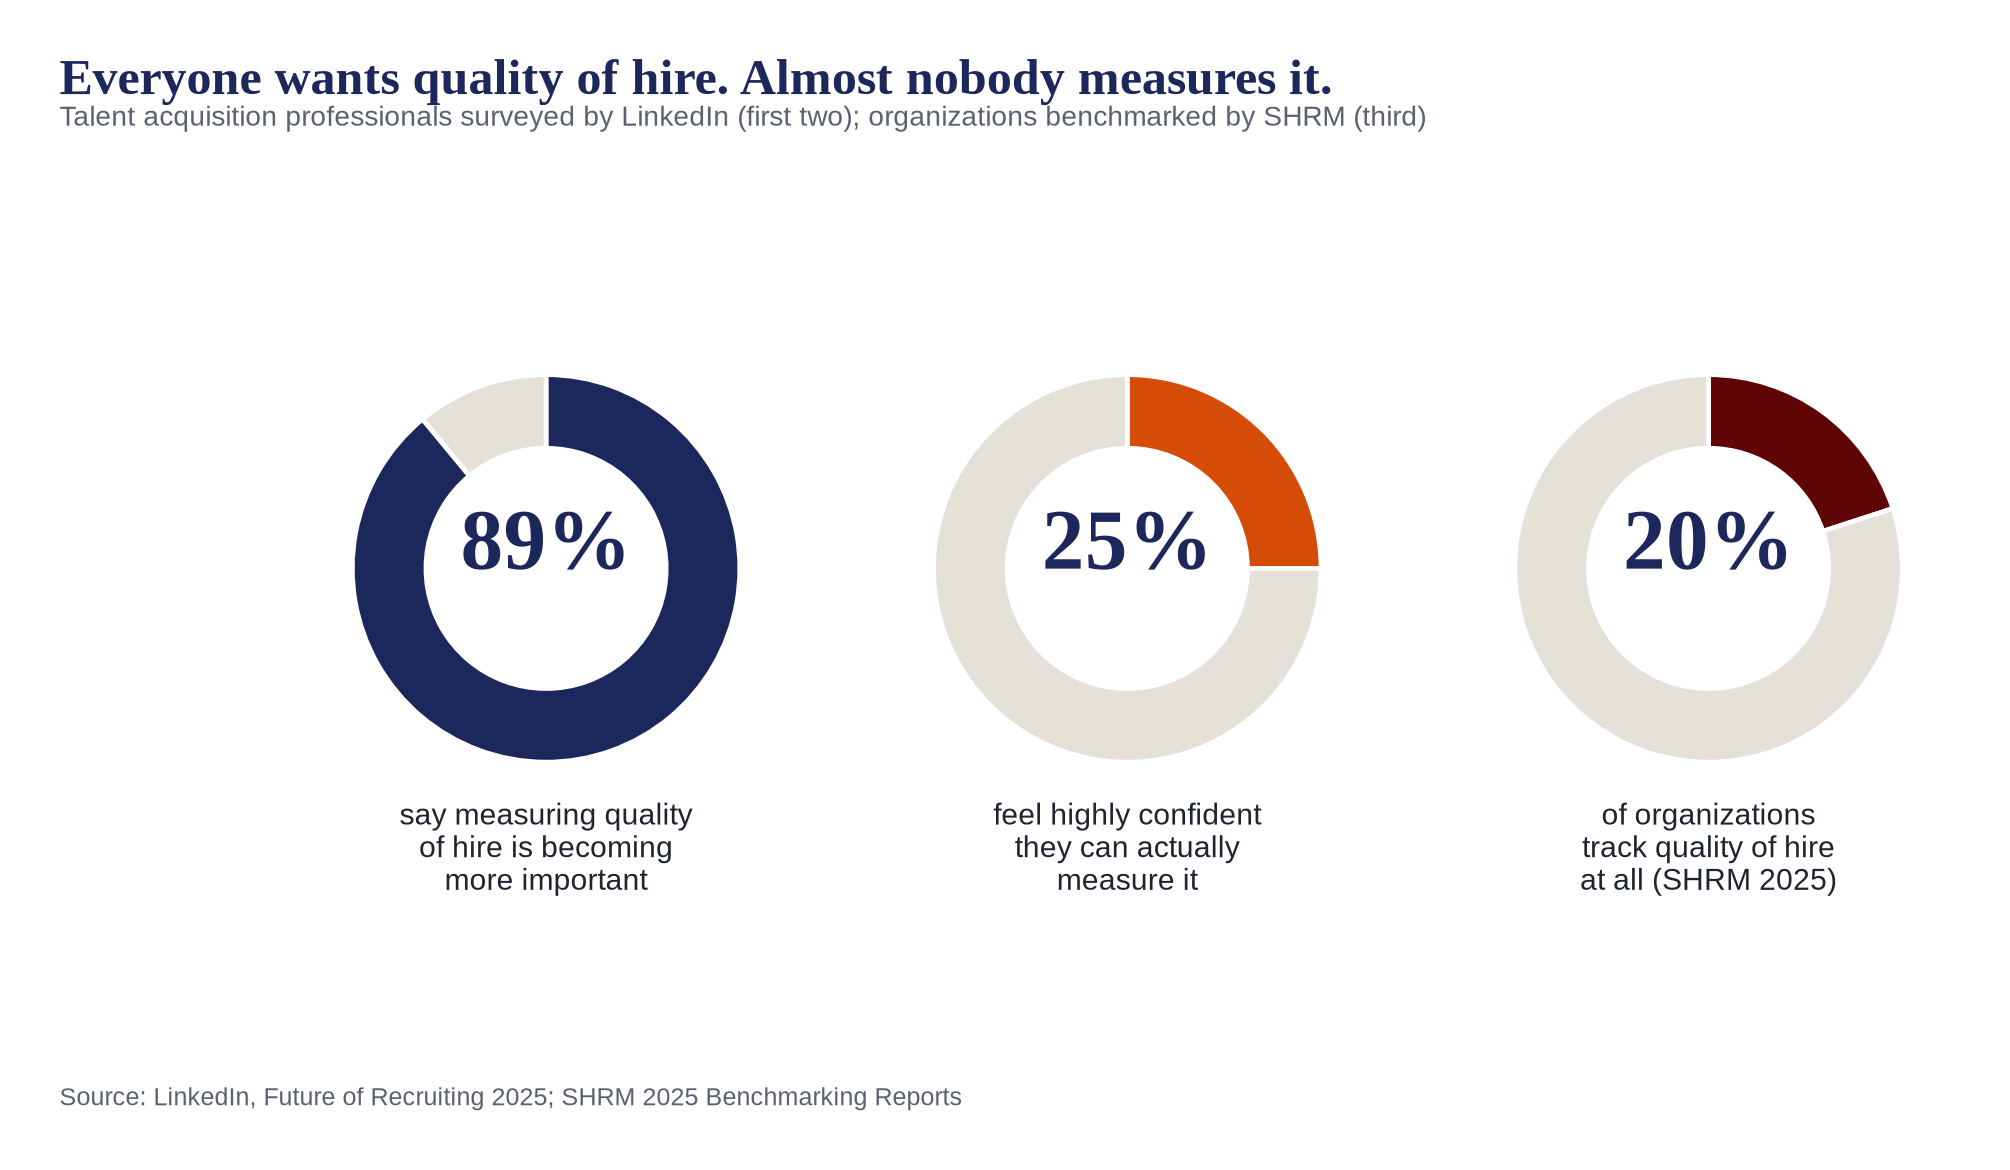
LinkedIn’s Future of Recruiting survey found 89% of talent professionals agree measuring quality of hire is becoming more important, yet only 25% feel highly confident their organization can measure it (LinkedIn). SHRM’s benchmarking shows just 20% of organizations track quality of hire at all (SHRM 2025).
Wharton’s Peter Cappelli made the same point in Harvard Business Review: companies have outsourced and automated hiring while almost never measuring whether it produces good employees (HBR, 2019). The result is a process optimized for volume and speed of rejection rather than for the outcome that matters.
Facts worth repeating in your next hiring meeting
- New-hire retention slipped as hiring sped up: 84.6% of 2025 hires were still employed at 90 days, down from 93.9% in 2024 (Employ).
- 52% of employees who quit say their manager or organization could have prevented it (Gallup).
- Sourced, passive candidates take 33 interviews per hire versus 19 for inbound applicants, which is why outreach needs dedicated capacity (Gem).
- Social media is the most-used recruiting strategy (59%) but ranks ninth in effectiveness (SHRM 2026).
- Companies running the most skills-based searches are 12% more likely to make a quality hire; 93% of recruiters call skills assessment crucial (LinkedIn).
- Job rotation programs are rated highly effective by 93% of HR professionals for hard-to-fill roles, yet fewer than 25% use them (SHRM 2026).
- Offer acceptance averaged 83.9% in 2025: 91% in manufacturing, 80.8% in software (Employ). One in six offers still walks.
- Recruiting consumes an average 26% of the HR budget, ranging from 10% to 39% across organizations (SHRM 2025).
What This Means for Your Next Hire
The data does not argue for hiring recklessly. It argues for hiring deliberately and quickly: decide what the seat is worth, run a structured process, reach the passive market, and move inside the ten-day window in which the best candidates choose. That is exactly what dedicated, project-based recruiting is built to do.
Call +1 (850) 556-1925 or email [email protected]
REFERENCES:
- U.S. Bureau of Labor Statistics, Job Openings and Labor Turnover Survey, August 2026 (released Sept. 29, 2026)
- U.S. Bureau of Labor Statistics, The Employment Situation, August 2026
- U.S. Bureau of Labor Statistics, JOLTS program and public data API (series JOL, HIR, QUR, LDR, UOR; LNS14000000)
- SHRM, 2025 Benchmarking Reports press release (cost per hire, quality-of-hire tracking, recruiting budgets)
- SHRM, 2026 Recruiting Executives Benchmarking: Attracting Critical Talent
- SHRM, 2026 Talent Trends Report press release
- Gallup, This Fixable Problem Costs U.S. Businesses $1 Trillion
- Robert Half research on candidate availability, summarized by Hyring
- Gem, 2025 Recruiting Benchmarks Report
- Greenhouse, Hiring Benchmarks 2026
- HR Dive, Companies are hiring faster from a deeper talent pool (Employ 2025 benchmarks)
- Tellent, State of Hiring report, via Recruitee
- NFIB, November 2025 Jobs Report
- Harvard Business Review, How Fast Should Your Company Really Grow? (March 2024)
- Startup Genome, Premature Scaling: A Deep Dive
- Harvard Business School Rock Center Startup Guide, 3 Consequences of Hypergrowth
- McKinsey & Company, Attracting and retaining the right talent
- United Way NCA, How Long Does It Take to Find a Job in 2026?
- Pin, Sourcing Metrics and Benchmarks 2026 (Gem and Ashby data)
- interviewstream, Hiring Experience Report 2026
- Jacob Kaplan-Moss, How Long Does It Take to Hire Someone?
- Federal Reserve Bank of Richmond, Visualizing the Low-Hire, Low-Fire Labor Market (Sept. 2026)
- Federal Reserve Bank of Cleveland, The Low-Hire, Low-Fire Labor Market (Aug. 2026)
- Indeed Hiring Lab, A Labor Market in Pause: What 2025 Tells Us About 2026
- Yahoo Finance, The job market looks steady. Underneath, hiring intentions are stirring (Sept. 29, 2026)
- Federal Reserve Bank of Atlanta, Wage Growth Tracker (September 2026 release)
- Indeed Job Postings Index, remote work tracker
- Second Talent, Remote Work & Hiring Statistics 2026 (Indeed, LinkedIn and Robert Half data)
- ZipRecruiter, More Jobs, Higher Bar: The 2026 AI Employer Report
- LinkedIn, The Future of Recruiting 2025
- Jobgether, Ghost Jobs: What They Reveal About Senior Hiring
- Schmidt, F. L., & Hunter, J. E. (1998). The validity and utility of selection methods in personnel psychology. Psychological Bulletin, 124(2), 262-274
- Peter Cappelli, Your Approach to Hiring Is All Wrong, Harvard Business Review (May-June 2019)
Charts were generated by People Placers Staffing from the cited data on September 30, 2026. BLS figures are seasonally adjusted and subject to routine revision. Where a statistic originates in a vendor dataset (Gem, Greenhouse, Employ, Ashby) it reflects that vendor’s customer base rather than the whole economy. We deliberately omitted the widely repeated claim that the U.S. Department of Labor estimates a bad hire at 30% of first-year earnings, because that figure cannot be traced to a Department of Labor publication.